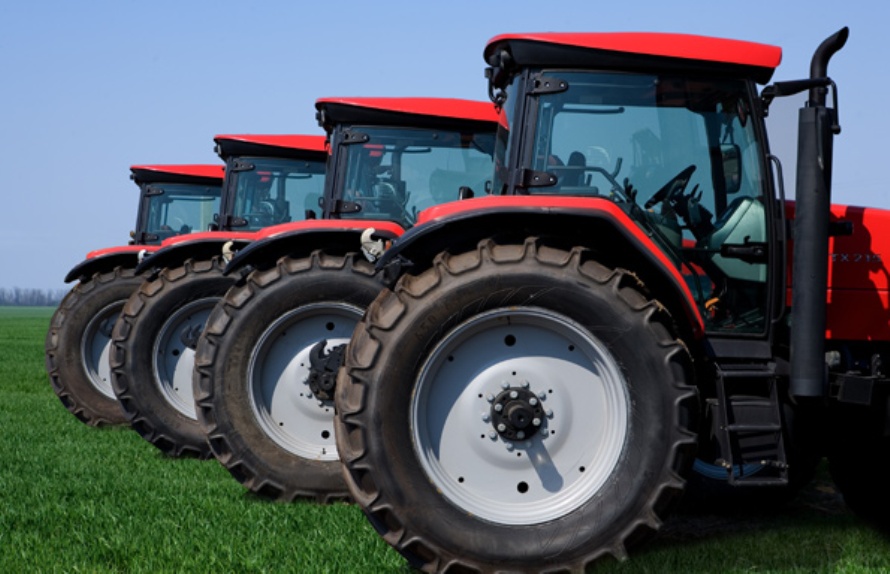
Tractor is symbolic and integral part of the overall agriculture sector in India and tractorisation as backbone of farm mechanization has played a pivotal role in bringing green revolution in the country. The industry has kept pace with the growth in overall economy and has been growing at a CAGR rate of 6-8% on production basis. Demand for tractors is highly dependent on the agriculture activity in the country and that invariably is dependent on monsoon and the minimum support price (msp). | |
From total manufacturing volume 2.2 lakh units in 1996-97 to a peak of 7 lakh units in 2013-14, the tractor industry has witnessed significant run and the period from 2002-03 till 2013-14 was a kind of bull run for the tractor industry in India. Domestic sales in FY18-19 is estimated to be ~ 7.8 lakh units and roughly 92,000 units of tractors were exported in the same year. Dominated by M&M that commands over 40% of market share followed by TAFE, there are over 12 major players. Unlike M&M which has national reach and presence, some of the other smaller players are more of a regional player. A wide array of tractors, ranging from 12 to 75 HP, is available to the Indian farmer. Amongst these, the most favoured tractor power segment among the farmers is 31–40 HP which contributes nearly 50% of the total tractor industry. In the last few years, a substantial shift has been observed towards higher HP segment due to increased use of implementation attached to tractor and better products/technologies that are predominantly supplied by all major Indian and global tractor manufacturers at competitive pricing. | |
Demand for tractors, varies from state to state, and this variance is driven by the size and scale of agricultural activity in any given state and the level of tractor penetration in a given state. Traditionally, Haryana, Punjab and Uttar Pradesh are the main States for the tractor market. In the last few years, the new markets for tractors are emerging in states of Madhya Pradesh, Andhra Pradesh, Tamilnadu, Maharashtra and Gujarat States. In terms of installed base of tractors, U.P form ~20% of the total installed base of 60 lakhs tractors, followed by Rajasthan at 13%, M.P, Haryana & Gujarat form 8% each in the total installed base. | |
Agriculture is main source of livelihood to majority of the population in agrarian states like U.P, Punjab, Haryana, M.P, etc and more than 70 percent of population directly or indirectly depend on agriculture and allied sectors. InfraInsights research “Estimating Demand for Tractors in India by 2024-25: Domestic Sales to touch 11-12 Lakhs units by 2024-25?” will adopt a mix of primary and secondary research based approach, to understand typical profile of farmers in different states, districts, land parcel held, tractors owned, crop production achieved and the prevailing msp and monsoon. Analysis of these variable will throw correlation between different parameters and will be insightful for tractor companies to position their products and better package their sales and marketing efforts. InfraInsights consultants will visit different towns / districts based on the agriculture clusters and do a ground up analysis to bring credible insights that will be of significant value to Tractor OEMs. |
- Executive Summary
- Research Approach & Methodology
- Tractor Market Landscape
- Key OEMs
- Key demand pockets
- Market classification by capacity ratings
- Demand variables
- Distribution structures
- Replacement cycle
- Trends in Tractor Sales in India
- Year wise production, sales & exports
- Month wise production, sales & exports
- Level of mechanization across major agrarian states in India
- Punjab
- Haryana
- Maharashtra
- Rajasthan
- Gujarat
- M.P
- Chhattisgarh
- Karnataka
- Others
- State wise
- Installed base of Tractors in India
- Yearly sales of Tractor in India
- Tractor Manufacturing Capacity in India
- Manufacturing capacity of different OEMs
- Manufacturing plants locations
- Capacity
- Trend in capacity utilization
- Manufacturing capacity of different OEMs
- Tractor Market in 2018-19
- Market by OEMs
- Market by capacity ratings
- Less than 30 hp
- 30-40 hp
- 40-50 hp
- Above 50 hp
- Market by States / Regions
- Market by states / region and OEMs
- Market by New vs Replacement
- Market by Domestic Sales Vs Exports
- Market by Domestic Vs Imports
- Benchmarking OEMs
- National Market Share
- Regional Market Share
- HP wise Market Share
- Product Portfolio
- Exports volume
- Sales & Distribution Network
- Customer Outreach Strategy
- Product Pricing
- Trend analysis on Rainfall & MSP for Crops
- Farm Loan Waivers and its Impact on demand for Tractor
- Scenarios for Forecast
- Pessimistic – taking cue from trend line in monsoon and msp
- Realistic – good monsoon in next 2 years followed by 1 or 2 years of below avg monsoon & one off MSP hike
- Optimistic – continuous 3-4 years of good monsoon backed by MSP hikes
- Replacement cycle
- Interest rate cycle
- End Consumer Interviews – Farmers (organized & unorganized), Industry
- Personal interviews across different states / regions to find factors that define new purchase or replacement of existing
- Projected demand for New Tractors by 2025 – Demand side forecast modelling by scenarios
- Demand by States / Region
- Demand by hp rating
- Demand – New Vs Replacement
- Market share of OEMs by States / Regions
- Market Share of OEMs by hp rating within each states / regions
- Projected demand for New Tractors by 2025 – Supply side forecasting
- Industry SWOT & PESTEL Analysis
- Company Profiles
- Agriculture profile of key states
- Land Utilization
- Land Ceiling Limit
- Operational Land Holding
- Major Crops, Production & Yields
- Cropping intensity
- District wise crop production
- Season wise crop production
- Segmentation of land parcels under cultivation
- <2.5 acres
- 2.5 – 5 acres
- li>5 – 20 acres
- > 20 acres
- Irrigation by different sources
- Shift in crop type
- Land Utilization
 We create value for our customers by amalgamating deep functional and energy industry expertise. Our solutions range from in depth research reports to advisory services enabling our customers with energy market insights to take informed decisions, grow and improve on their competitiveness.
Leveraging our breadth of geographical reach we provide solutions in entire energy value chain be it coal, power, oil and gas or renewable. We are a reliable and efficient source comprising of best in class talent pool which provides answer to all the challenges of the energy industry


