Skip to content
InfrainsightsInfrainsightsInfrainsights
  • Home
  • About Us
  • Service Offering
    • Report
    • Research
    • Consulting
    • Analytics
    • Databases
  • Newsletter
    • Daily Newsletter
    • Weekly Newsletter
  • CLIENTS
  • CAREERS
  • Contact Us

Author: admin

Infrainsights > Articles by: admin
Upcoming Reports

Renewable Energy Markets Competitiveness in India: Best States for Investments in Renewable Energy Sector in India

September 20, 2023 admin No Comments
Overview of Reports
Table of Contents
Value Propositions
Request Flyer
Overview of Reports

The emerging technical, economic, political, policy and several other market factors pertaining to renewable energy sector in India, entails detailed evaluation is undertaken by investors keen in investing in India renewable energy growth story before committing investments. Attractiveness associated with investing in renewable energy in India varies from state to state and hence it is important to benchmark critical factors that make any market attractive or not so attractive for investments in renewable energy. InfraInsights through its research report “Renewable Energy Markets Competitiveness in India: Best States for Investment in Renewable Energy Sector in India” aims to provide investor community (PEs, VCs, Investment Banks, Project Financiers, Promoters, Banks, NBFCs, Companies) both in India and outside, a detailed benchmark of factors that differentiates state that leads in renewable energy investment vis-à-vis the laggards. The report will benchmark each state on 9 parameters and each of these parameters will be scored over a scale of 1 to 10 (1 = lowest, 10 = highest) for performance of renewable energy on respective parameters in the half year of the fiscal year in consideration and the projected performance for the same half year of the next fiscal year; first report will cover H2 FY23-24 and H1 FY24-25.

The intent is to provide one of its kind robust frameworks that will measure the development of Renewable Energy Market Competitiveness Intensity (REMCI) across different states of India that are witnessing traction and are likely to witness traction in terms of investment in renewable energy. The REMCI Index will reflect how attractive a particular renewable energy market in India is to new investor in terms of the competitive environment. RE-MCI framework will comprise of nine parameters grouped into three broad clusters: Market framework, Supply Market Maturity, Demand Market Maturity. Each of the nine parameters will be rated across the scale to allow for the comparison of distinct renewable energy markets seen in over 15 states in India. RE-MCI index will measure competitiveness of renewable markets over 15 states across North, South, West, East and North East.

How Renewable Energy – Market Competitiveness Intensity (RE-MCI) Framework will help?

The RE-MCI Framework is designed in mind to help investors, financiers, developers, market regulators, traders, power exchanges gauge the market competitiveness of renewable energy market in a particular state from investment perspective both for existing or new market entrants.

  • The RE-MCI will provide clear view on which states are leaders, which ones are challenger’s leaders, which ones are emerging and which ones are laggards.
  • Provide comparative view on how each state compare with others on each and every parameters across the three broad cluster viz: Market framework (regulation, infrastructure, conducive to technology- topography), Supply Market Maturity, Demand Market Maturity
  • Provide immediate short term outlook on whether the score of states across the parameters within three clusters will improve or drop over a period of one year. Half year of current fiscal vs same half year next fiscal.
  • RE-MCI will be published twice in a year to ensure that development in the markets over a period of six months are reflected and accordingly changes atleast every half yearly.

Overall, the RE-MCI will be a great tool for companies that they can refer to when it comes to either taking an investment call or exit call from renewable energy market of a particular state or in terms of managing the overall renewable energy investment portfolio in India.

This is brief about RE-MCI research that InfraInsights has conceived and a detailed flyer and table of content will be released soon. In order to ensure that we increase the utility of this research product for Industry, we want to hear from you on how we can further better this product for industry utility. The product will be a subscription product and half yearly update will be provided. Each state will have individual analysis module which will provide details on how the state compares with other states on a particular parameter within the three clusters i.e. (Market framework, Supply Market Maturity, Demand Market Maturity)

Table of Contents
  1. Renewable Energy in India: Story So Far
  2. Evolution of Renewable Energy in India
    1. Wave 1: Wind Capacity Blows
    2. Wave 2: SHP & Biomass, Wind Gains Momentum
    3. Wave 3: Explosion of Solar
  3. Stakeholders in Indian Renewable Energy Market
  4. Growth Drivers
    1. Regulatory
    2. Policy
    3. Market Structure
    4. Technology Industrialization & its inroads in India
  1. Growth Barriers
    1. Financing Risk
    2. Technology Prejudice
    3. Inconsistent Policy Support
    4. Effective Implementation of Regulations
  1. Early Pioneers in Renewable Energy
    1. Technology – Wind
    2. State – Tamil Nadu
    3. Company – Suzlon, Tata BP Solar
    4. Industry – Cement & Textiles
  1. Roadblocks to Sustainable Growth of Renewable Energy in India
    1. Lack of Vision / Roadmap
    2. Infrastructure Constraint
    3. Policy Inconsistencies & divergence
    4. Financing Challenges
    5. Regulatory Non Compliance
    6. Lack of Portfolio Approach
  1. Renewable Energy Markets in India: 29 States represents 29 different RE markets in One Country
    1. RE Potential Vs Installed Capacity in each state
    2. State Government Policies across states for Wind, Solar, Biomass and SHP
  1. About the RE-MCI Framework
    1. Introduction
    2. Approach & Methodology
  1. Best States to Invest in Solar (15 States will be analysed over 3 clusters and each parameter under the clusters will be rated over scale of 1 to 10 for current performance and projected year ahead performance. There will be 8-10 page for each state covering 10.1, 10.2, 10.3 and 10.4.)
    1. Market Framework
      1. Policy & Regulatory Framework
      2. Effectiveness of Regulator
      3. Initiative / vision & strategy to attract Investment in Solar
      4. Power Evacuation Infrastructure
      5. Techno-Commercial Constraints & Barriers
    2. Supply Market Maturity
      1. Potential Vs Exploitation
      2. Operational Performance
      3. Market Concentration
    1. Demand Market Maturity
      1. Sustainability of Demand
      2. RPO Compliance Trend
      3. Demand Profile
    1. Benchmarking of all 15 states against 11 parameters (Will represent how a state compare with other state across every parameter states above when compared to remaining 14 states).
  1. Best States to Invest in Wind
    1. Market Framework
      1. Policy & Regulatory Framework
      2. Effectiveness of Regulator
      3. Initiative / vision & strategy to attract Investment in Wind
      4. Power Evacuation Infrastructure
      5. Techno-Commercial Constraints & Barriers
    2. Supply Market Maturity
      1. Potential Vs Exploitation
      2. Operational Performance
      3. Market Concentration
    1. Demand Market Maturity
      1. Sustainability of Demand
      2. RPO Compliance Trend
      3. Demand Profile
    1. Benchmarking of all 15 states against 11 parameters (Will represent how a state compare with other state across every parameter states above when compared to remaining 14 states).
  1. Best States to Invest in Biomass Energy
    1. Market Framework
      1. Policy & Regulatory Framework
      2. Effectiveness of Regulator
      3. Initiative / vision & strategy to attract Investment in Biomass
      4. Power Evacuation Infrastructure
      5. Techno-Commercial Constraints & Barriers
    1. Supply Market Maturity
      1. Potential Vs Exploitation
      2. Fuel Constraints & Operational Performance
      3. Market Concentration
    1. Demand Market Maturity
      1. Sustainability of Demand
      2. RPO Compliance Trend
      3. Demand Profile
    1. Benchmarking of all 15 states against 11 parameters (Will represent how a state compare with other state across every parameter states above when compared to remaining 14 states).
  1. Best States to Invest in Small Hydro Power (SHP)
    1. Market Framework
      1. Policy & Regulatory Framework
      2. Effectiveness of Regulator
      3. Initiative / vision & strategy to attract Investment in SHP
      4. Power Evacuation Infrastructure
      5. Techno-Commercial Constraints & Barriers
    1. Supply Market Maturity
      1. Potential Vs Exploitation
      2. Operational Performance
      3. Market Concentration
    1. Demand Market Maturity
      1. Sustainability of Demand
      2. RPO Compliance Trend
      3. Demand Profile
    1. Benchmarking of all 15 states against 11 parameters (Will represent how a state compare with other state across every parameter states above when compared to remaining 14 states).
Value Propositions

We create value for our customers by amalgamating deep functional and energy industry expertise. Our solutions range from in depth research reports to advisory services enabling our customers with energy market insights to take informed decisions, grow and improve on their competitiveness.

Leveraging our breadth of geographical reach we provide solutions in entire energy value chain be it coal, power, oil and gas or renewable. We are a reliable and efficient source comprising of best in class talent pool which provides answer to all the challenges of the energy industry.

Request Flyer

Please contact us at info@infrainsights.com for the flyer

Upcoming Reports

InfraInsights Research Report on LPG Market in India by 2030: Statewise and District Wise Monthly Sales of LPG by OMCs and PMCs

September 20, 2023 admin No Comments
Target Audience(s)
Table of Contents
Key Questions Answered
Request Flyer
Target Audience(s)
Our target audience is significantly diverse and ranges from thought leadership seekers/market speculators to those looking for an independent intelligence before committing their resources or capital. Our laundry list includes:
 
Target audience Reasons to buy
LPG Import Terminal Developers LPG terminal developers and operators are the gate keepers of imported LPG in India. New investments are being contemplated and decisions under-progress that require independent assessment of market opportunities and sustainability of demand for LPG.
LPG Importers & Suppliers The report gives a clear direction to the importers & suppliers of LPG. India is the 2nd largest LPG importer in the world. Hence, it is crucial to fully understand the market opportunities to make a robust strategy for future business growth.
Oil Marketing Companies and Parallel Marketers The OMCs and PMCs are the enablers and creators of LPG sector in the country. With growth potential and new players coming-in there is going to be a significant competition across the board. With new growth centers and geographical enhancement, whoever makes an early move will be benefitted. The report identifies such opportunities for a period upto 2030.
Cylinder Manufacturers With new demand hubs being created such as rural LPG households as well as favorable scenario for AutoLPG, for the cylinder manufacturers it is the best time to look for M&A and capacity enhancement.
Government Agencies/Policy Makers The report will be vital for the Government and its policy making agencies who have the mandate of achieving the end objective of making India run on Clean Fuels.
Table of Contents
  • Executive Summary
  • Global LPG Market Outlook
    • Demand – Supply trend
    • International LPG/C3 & C4 pricing trend
    • Major LPG hubs
    • India’s footprint on Global LPG map
  • Status of LPG infrastructure & penetration in India
    • LPG Pipelines: Readiness, Regional spread, Capacity and Usage
    • Domestic LPG production capacity: Refineries & Fractionators
    • Growth in number of LPG connections
    • Existing and Emerging (Proposed/Planned/Upcoming) LPG Import Terminals
  • LPG Industry Structure
    • Government Agencies
    • Private Associations
    • Key Public & Private Players
  • Competitive Landscape
    • Mapping key public and private sector players
    • Market positioning and key strengths (including control over supply chain)
  • Snap-shot of present and upcoming Government Policies for LPG Sector in India
  • LPG Price Indexation
    • Competing Fuels – Furnace Oil, Naphtha, HSD-Auto, Petrol, PNG and CNG
    • Competing Segments – Residential, Transport, Commercial and Industrial
    • Imported LPG vs. LNG
  • Evolution of LPG consumption in India
    • Total consumption increase
    • Historic growth trends for LPG consumption
    • Demand drivers of LPG in India
  • Future Outlook on LPG demand (2024-2030), based on
    • Residential Segment
    • Transport Segment
    • Industrial Segment
    • Commercial Segment
  • Existing and Future Outlook on LPG Imports in India (2024-2030)
    • Historic LPG Imports Trend
    • Major international LPG supply destinations
    • Indian Refinery and Fractionator Potential for domestic LPG production
      • Scenario – A
      • Scenario – B
    • Outlook on India’s dependence on LPG imports based on Scenario A and Scenario B vis-à-vis projected demand
  • High-level assessment of adequacy of existing LPG import terminals to meet Demand-Supply Gap
    • Existing LPG import terminal capacity and through-put
    • Opportunity for capacity enhancement or new capacity addition
  • Emerging demand for LPG cylinders (in nos.) and its high-level impact on the entire supply chain of cylinder related manufacturing and imports
  • Overview on overall investment potential in LPG Sector in India
  • Conclusion
Key Questions Answered
  • What is the existing and evolving market size for LPG in India?
  • What is the emerging demand for LPG cylinders in India?
  • What is the existing competitive landscape for LPG sector in India?
  • What are the opportunities for private/parallel marketing companies of LPG in India?
  • What are the new demand centres for LPG in India? Whether the supply & logistics infrastructure in these demand centres adequately developed to sustain future growth?
  • Whether auto manufacturing companies should focus on LPG fitted variants since economics of running on AutoLPG is favourable?
  • Whether LPG has a sustainable future given the fact that India is also pushing for natural gas sector development?
  • What are the immediate infrastructure gaps/bottlenecks in LPG infrastructure?

What is the outlook on overall investment potential in LPG sector in India given the stellar growth in LPG consumption?

Request Flyer

Please contact us at info@infrainsights.com for the flyer

Upcoming Reports

WASTE TO ENERGY OPPORTUNITIES IN INDIA

September 20, 2023 admin No Comments
Overview of Reports
Table of Contents
Key Questions Answered
Value Propositions
Overview of Reports
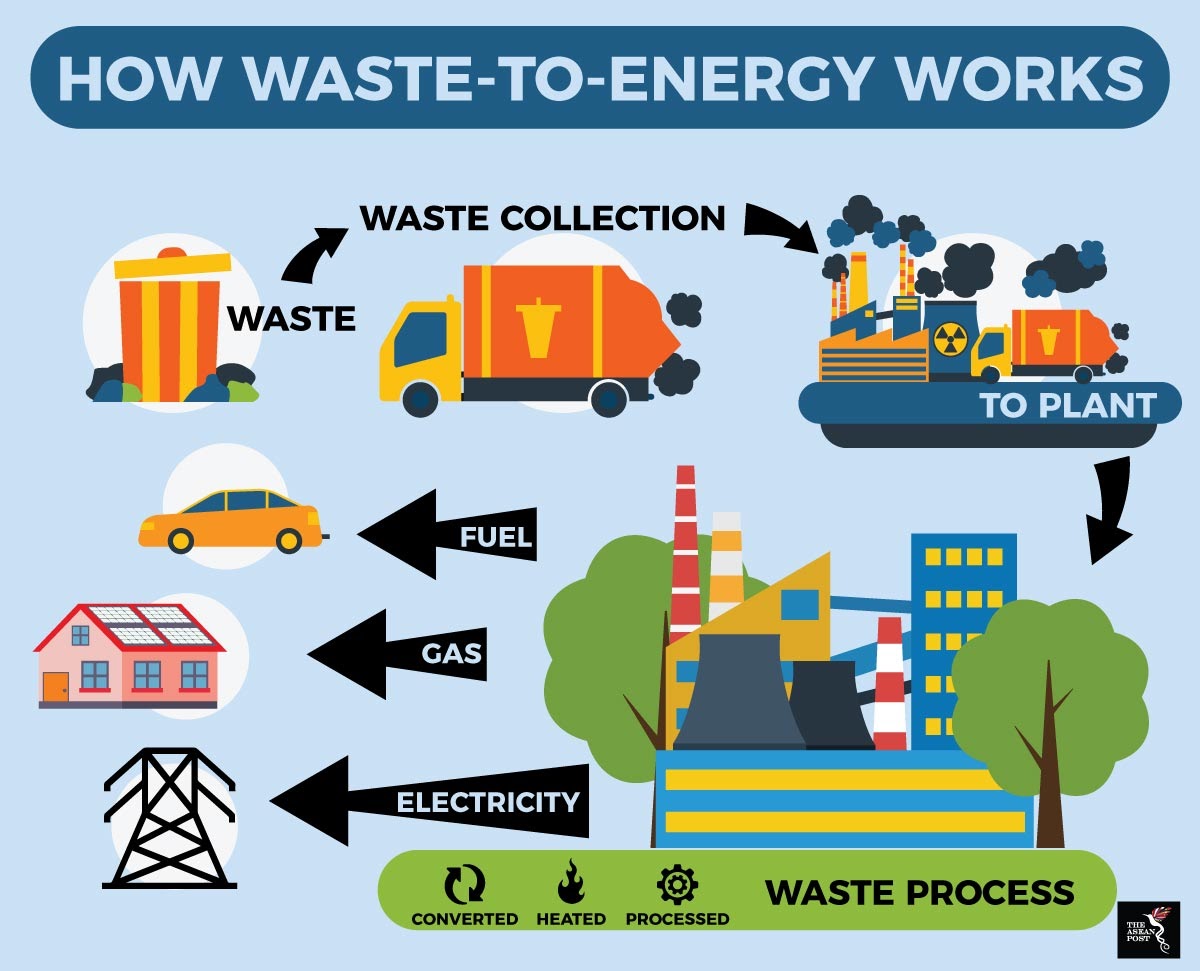
India is a developing nation housing second largest population in the world. Industrialization is the key to sustain the growth story of India. Industrialisation has led to urbanization and has therefore induced life style changes, giving rise to generation of increasing quantities of wastes leading to increased threats to the environment. In India, 62 million tonnes of waste is generated annually. The per capita waste generation in Indian cities ranges from 200 grams to 600 grams per day. Out of 62 million tonnes of waste, 43 million TPA is collected, 11.9 million is treated and 31 million is dumped in landfill sites, which means that only about 75-80% of the municipal waste gets collected and only 22-28 % of this waste is processed and treated. Waste generation in India is expected to increase rapidly in the future. As more people migrate to urban areas and as incomes increase, consumption levels are likely to rise, as are rates of waste generation.  It is estimated that the amount of waste generated in India will increase from 62 million tonnes to about165 million tonnes in 2030.This will have significant impact on the amount of land that is and will be needed for disposal, economic costs of collecting and transporting waste, and the environmental consequences of increased MSW generation levels.
In developed countries, environmental concern is the prime motivator for the countries to invest in waste-to-energy projects, which help in treating and safe disposition of wastes. Energy or power is considered as a by-product, improves the viability of such projects.
In an aim to boost WTE sector in India, Ministry of Environment and Forests has revised Solid Waste Management Rules which has introduced responsibility on generators to segregate waste into three categories – Wet, Dry and Hazardous Waste. The new Rules also assign responsibility on local bodies having 1 million or more population to set up waste processing facilities within two years. India, with its ambitious target of adding 175 GW of renewable energy to the grid by 2022 plans to add 10 GW of electricity generation capacity from bio-power. Further, the Tariff Policy 2016 mandates power distributors to buy all the electricity generated from waste-to-energy plants in a state and the remunerative tariff set for it by the Central Electricity Regulatory Commission (CERC) has helped raise investor interest in this segment. The municipal corporations are expected to receive Rs.15,000 crore over the next three years under the Swachh Bharat Mission for cleanliness, waste-management and waste-to-energy projects. Also, the government is also setting up a $1.25 billion fund, backed by state-owned Power Finance Corp. Ltd and Rural Electrification Corp. Ltd along with some private institutions. These allocations, together with private partnerships, could result in an investment of about Rs.65,000 crore in these projects over the next three years.
Table of Contents
  1. Executive Summary
  2. Approach & Methodology
  3. Types of WTE projects
    1. Urban Wastes
      1. Municipal Solid Waste
      2. Sewage
      3. Fecal Sludge
    2. Industrial Waste
  4. Key Regulations & Policies governing Waste to Energy (WTE) Sector
    1. Electricity Act, 2003
    2. National Electricity Policy
    3. Tariff Policy
    4. Central Sector Regulations
    5. State Regulations
  5. Policy/Financial Incentives for establishment of WTE projects in India
    1. Central Government
    2. State Government
  6. State-wise potential of WTE in India
  7. State-wise capacity addition over the years
  8. Permits & Clearances – assessing ease of setting WTEproject in India
    1. Number of clearances required – central & state
    2. Time taken to acquire permits & clearances
    3. Challenges in acquiring land
  1. Best States to invest in WTE projects in India
    1. Policy Attractiveness
    2. Ease of setting up solar project
    3. Paying ability
    4. Industry Cluster
    5. T&D infrastructure
  2. Appropriate Technology Options
    1. Incineration Technology
    2. Biomethanation process
    3. Pyrolysis
    4. Gasification
  3. State-wise Tariffs applicable for WTE projects in India
  4. Market participants in WTE Sector in India
    1. Private Sector
    2. Public Sector
  5. Status of MSW based Power Generation Projects
    1. Jindal power project, Okhla
    2. Solapur Bioenergy Systems Pvt. Ltd.
    3. Rochem Green Energy Pvt. Ltd (RGEPL)
    4. Essel Infra Pvt. Ltd
  6. Challenges faced byWTE Projects in India
  7. Business Opportunity along WTE value chain
Key Questions Answered
  1. What are the policy measures in place to promote WTE?
  2. Which are the municipal bodies that are investing in MSW to Energy projects?
  3. What are the different operational and planned WTE projects in India?
  4. Which are the top technology companies in WTE sector?
  5. How solid waste management is anticipated to happen in a smart city construct?
  6. What is the commercial structure under which WTE projects are operated?
  7. Which is the leading EPC Company in WTE space?
Value Propositions

We create value for our customers by amalgamating deep functional and energy industry expertise. Our solutions range from in depth research reports to advisory services enabling our customers with energy market insights to take informed decisions, grow and improve on their competitiveness.

Leveraging our breadth of geographical reach we provide solutions in entire energy value chain be it coal, power, oil and gas or renewable. We are a reliable and efficient source comprising of best in class talent pool which provides answer to all the challenges of the energy industry.

Published Reports

Evaluating Go-To States for Setting up New Manufacturing Facility in India: Corporate Tax Cut Makes India and Attractive Investment Decision, find out which are the top states for making Fresh Investment in India

September 20, 2023 admin No Comments
Overview of Reports
Table of Contents
Value Propositions
Request Flyer
Overview of Reports

Trade war between US and China, Corporate Tax Cut by India and Improvement in Ease of Doing Business in India augurs well for the Indian economy assuming that the slowdown in global economy do not last long and resumes growth trajectory soon. All the macro indicators augurs well for Indian economy and slew multiple reform announced by Indian government to stem the slowdown in economy is anticipated to yield results in 2-3 quarters from now. India is certainly one of the most favoured investment destinations and every company in the world would want to take advantage of the new economy that’s shaping under Modi 2.0. The recent cut in corporate tax rate for existing companies to 22 percent from 30 percent, and to 15 percent from 25 percent for new manufacturing firms incorporated after October 1, 2019, and starting operations before March 31, 2023 is a bold move by the Government of India. This move has made India a very attractive destination for foreign investment. India’s corporate tax rates have become very competitive compared to those of other emerging market economies in ASEAN and other parts of Asia. For any company that plans to make new investment, no country is offering 15 per cent tax rate. We are giving 15 per cent with no MAT (minimum alternate tax) and simpler taxation structure. The economy that is reeling under slowdown, this is a bold reform that will enable India resume its growth trajectory on the back anticipated increase in foreign direct investment. The cut in corporate tax rate has coincides with the improvement India has seen in its ease of doing business, India’s rank in the World Bank’s Ease of Doing Business 2020 index has vaulted 14 places to 63rd among 190 economies.

When it comes to making Go-No Go decision on new investment, it becomes important to do in-depth analysis beyond the headline indicators, this becomes more important when a company is entering in a market where state specific variables can make successful outcome a difficult task. With over 29 states and 7 union territories, shortlisting investment location is not an easy task and InfraInsights aims to enable companies to take informed decision by understanding the attractiveness and risks associated with each state in India, especially when it comes to make right investment decision. InfraInsights research report “State Investment Attractiveness Index: Evaluating Go-To States for Setting up Manufacturing Facility in India”, will enable companies to find out which are the best Go-To states for making Fresh Investment in India. The report aims to do a competitive benchmarking of leading states on parameters like resource attractiveness, policy attractiveness, political attractiveness, environmental attractiveness, infrastructure attractiveness, industry attractiveness and based on all parameters shortlist most attractive investment location /cluster in a given state. The research is a mix of qualitative and quantitative benchmarking which will help companies take informed decision. The report will also help companies that have taken decision on investing in India but are evaluating which state in India it should set up shop basis factors like availability of land, labour, water, electricity, political stability, proximity to port, roads and highway infrastructure etc.

Table of Contents
  1. Executive Summary
  2. Approach & Methodology – Market Attractiveness Framework
  3. Overview on Indian Economy
  4. Reforms under Modi 1.0 and 2.0
  5. Key Industries in India
    1. Manufacturing
    2. Automobile
    3. Steel
    4.  Cement
    5. Electrical &  Electronics
    6. Chemical
    7. Others
  6. Most Industrialized States in India
  7. Shortlisting States for Investment Attractiveness Analysis [12-15 States]
    1. PESTEL
    2. Capex
    3. FDI
    4. Region wise -East, West, North, South
  1. Investment Attractiveness Index of Key Industrialized States in India
    1. Resources Attractiveness: Resources Availability & Competitiveness
      1. Land
      2. Water
      3. Electricity
      4. Labour
      5. Raw Materials
    2. Policy Attractiveness: Government Enabling Policies & Regulations
      1. Number of Permits & Clearances Required
    3. Politics Attractiveness: Political Stability
    4. Environmental Attractiveness
      1. Weather / Climate / Temperatures
      2. Natural Calamity etc – Flood, Earthquake instances
    5. Infrastructure Attractiveness
      1. Proximity to Ports
      2. Infrastructure
      3.  Road
      4. Railways
      5.  ICDs
      6. Warehouses
    6. Industry Attractiveness: Maturity of Existing Industries
      1. Which industries are present in state & why?
      2. What is the state GDP category
    7. Key Locations / Cluster
      1. InfraInsights recommendation which are the key cluster for setting up new manufacturing facility
      2. Best suited for which type of industry
Value Propositions
We create value for our customers by amalgamating deep functional and energy industry expertise. Our solutions range from in depth research reports to advisory services enabling our customers with energy market insights to take informed decisions, grow and improve on their competitiveness. Leveraging our breadth of geographical reach we provide solutions in entire energy value chain be it coal, power, oil and gas or renewable. We are a reliable and efficient source comprising of best in class talent pool which provides answer to all the challenges of the energy industry
Request Flyer

Please contact us at info@infrainsights.com for the flyer

Published Reports

Micro grid opportunity in India: Identifying Unelectrified Locations that are best fit for electrification through microgrids

September 20, 2023 admin No Comments
Overview of Reports
Table of Contents
Value Propositions
Request Flyer
Overview of Reports

After missing the initial deadline of May 2017, On April 2018, the Narendra Modi government announced that the electrification of all inhabited villages in India has been completed. While the announcement and achievement are significant, it is still largely symbolic and not substantive in nature as electrification of villages does not translate into electrification of households and is certainly no guarantee for power availability. Devil lies in details, in the definition of what means 100% electrified village, and as per the Union power ministry’s definition, a village is said to be electrified if at least 10% of the households in it have power connections and if electricity is provided in public places such as schools, panchayat offices, health centres and community centres. One shouldn’t be surprised if one encounters a village where there is just 1 bulb light on a bamboo pole and the village is declared as electrified, hence, even though 100% electrification of villages has been achieved, government data shows that as of today, there are still 31 million households without electricity. In states like Uttar Pradesh, Jharkhand and Assam, fewer than 60% of households have electricity, four years after the BJP came to power on the promise of “electricity for all”. In 12 out of the 30 states, fewer than 80% of the households have been electrified. The Modi government has promised to deliver uninterrupted power supply to all households by March 2019, which seems to be a much more difficult task.

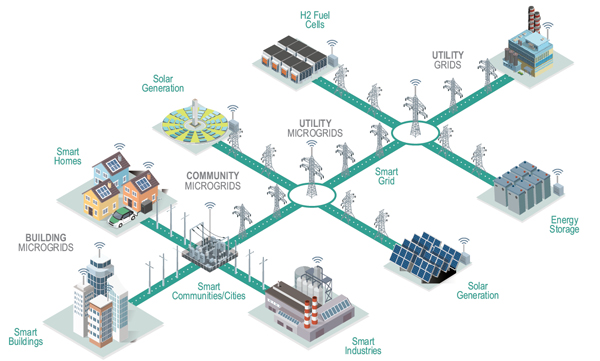
Most of these un-electrified areas across different states are miles away from the grid and hence it is only advisable to take a call on grid extension vs evaluating off-grid solution basis the population that needs to be supplied with electricity and the projected demand for power. India is blessed with abundant sources of renewable energy like, wind, solar, small hydro power, and if these cheaply available resources are harnessed along with energy storage solutions, in a microgrids set-up, it can provide reliable and consistent power supply, in remote rural areas. Further, such microgrids enable the infusion of investment at the community level and provide an avenue for revenue generation to the communities through the feed-in tariff mechanism. In addition, by installing distributed generation assets throughout the network, utilities can fall back on them for ancillary services during times of emergency. Microgrids not only enable the maximum integration of renewable energy, but also provide greater load flexibility and better demand management. In an attempt to promote microgrids in India, the government issued a draft national policy on renewable energy based mini- and microgrids. The policy proposes to set up at least 10,000 renewable micro-and minigrid projects across the country, with 500 MW of generation capacity to be developed by private players by 2022 in order to cater to around 237 million people experiencing energy shortage.

Microgrids utilise various generation resources including diesel, solar photovoltaic (PV), micro-hydro and biomass gasification, and also employ hybrid technologies such as wind-diesel and PV-diesel. While diesel-based microgrids are the most commonly used globally, solar PV systems are also gaining popularity due to the reduced cost of PV modules and solar PV equipment. In India, solar microgrids with an aggregate capacity of 1,899 kWp have been installed so far in 63 villages with financial support (30 per cent of the project cost) from the Ministry of New and Renewable Energy (MNRE). Thus, for a 10 kW direct current microgrid, the MNRE offers Rs 105 per watt, and for systems with a module capacity of 10-250 kW, it offers Rs 90 per watt. The systems come with a minimum warranty of five years in the rural and remote areas of the country. In India, key players in the microgrid market include Gram Power, Mera Gao Power, DESI Power, Omnigrid Micropower Company and Gram Oorja Solutions. Most of these players deploy solar-based microgrids in combination with smart grid technologies in states such as Karnataka, Maharashtra, Uttar Pradesh and Bihar. Currently, commercial investors are sceptical about investing in the microgrid market due to a perceived lack of visibility, market maturity, and scalability concerns. Given the increasing global focus on renewable energy generation and commitments to counter climate change, microgrids offer a range of benefits. There are challenges but the advantages outweighs these and the technology interventions, government support will pave way for economically sound micro-grid based power distribution system which is self-sustainable, operates in tandem to grid or on a complete independent grid basis. InfraInsights research report “Micro grid opportunity in India: Identifying Unelectrified Locations that are best fit for electrification through microgrids”, outlines why micro-grid which has only scratched the surface is likely to become huge in India market and it’s a perfect PPP model to achieve 100% household level access to electricity by 2024-25. Micro-grids utility will be beyond last mile connectivity and will find its way into industrial captive power, commercial captive and even at individual residence cluster level.

Table of Contents
  1. Executive Summary
  2. Research Approach & Methodology
  3. Decentralized Distributed Generation in India
  4. About Micro-grids & its technology landscape
    1. Components of micro-grid
    2. Types of micro-grid
    3. New types of micro-grid
  5. Policy Initiative to promote Microgrid in India
  6. Benefits & Challenges associated with micro-grids
    1. Adoption barrier
    2. Integration challenges
  7. Micro-grids progress & potential in India
    1. Microgrid installations across India
    2. Estimated Potential
    3. Projects in pipeline
  8. Potential locations, clusters for micro-grid project
  9. Governance, Policy & Regulations on Microgrid in India
    1. Draft policy on micro and mini grids
    2. MNRE definition of a Microgrid
    3. Proposed tariff structure
    4. Permits & Clearances
  10. State level regulations and policies on micro-grid
  11. Case studies / profile of operating micro-grid projects in India market – evaluating successes, challenges & key learning’s
  12. Key companies in India in the Microgrid solution providers in India
    1. Products, Projects & Services
  13. Business model of a micro-grid & perceived barriers
    1. Business Model
      1. Lighting only
      2. Lighting plus
      3. Anchor Load
    2. Barriers
      1. Threat of grid extension
      2. Payment system
      3. Funding
      4. Project scale and size
      5. Poor demand for power
      6. Levelized cost of electricity
      7. Grid parity
  14. Go-To Market Strategy
Value Propositions
We create value for our customers by amalgamating deep functional and energy industry expertise. Our solutions range from in depth research reports to advisory services enabling our customers with energy market insights to take informed decisions, grow and improve on their competitiveness. Leveraging our breadth of geographical reach we provide solutions in entire energy value chain be it coal, power, oil and gas or renewable. We are a reliable and efficient source comprising of best in class talent pool which provides answer to all the challenges of the energy industry
Request Flyer

Please contact us at info@infrainsights.com for the flyer

Published Reports

Successful ICE to EV Migration: InfraInsights Playbook for Auto component OEMs to navigate successfully into EV regime.

September 20, 2023 admin No Comments
Overview of Reports
Table of Contents
Value Propositions
Request Flyer
Overview of Reports

Government announcement on 100% EV by 2030 has hit the overall Automotive Industry like bolt from the blue and almost all industry stakeholders are at various stages of planning to make themselves immune to the emerging EV disruption that is likely to render companies staying in denial mode obsolete. Companies that will remain focussed on legacy products will face an existential crisis and those that will embrace the EV and new-age mobility disruption are likely to survive and thrive.

Push towards EVization will see some companies entering into new while existing traditional business and recent sales of BOSCHs’ starter and generator division to SEG is indicative of that trend. The e-rickshaw space is gaining traction when compared to PV, 2W, and 3W that are still a few years away from industrialization, this has led to companies like SEG, TVS Lucas Ltd to launch products that cater to e-rickshaw space.

Both automobile OEMs and automotive component OEMs are at crossroads in terms of making investment EV and also at what pace they should go about their investment, this to ensure that the breakeven point is not a stretched one. Automotive Industry worldwide is fast changing from IC to Hybrid to EV, while IC will not vanish over next 5 -10 years but it will eventually succumb to newer technology over a period of 20-30 years if not in the next 10 years. InfraInsights have been researching and advising companies on risks and opportunity in EV since the time Minister of Roads & Transport, Mr. Nitin Gadkari made the announcement on EV in 2017. InfraInsights through its detailed research-based consulting proposition, aims to enable auto component manufacturers to navigate the transition from IC to EV seamlessly and provide them with a transition blueprint that outlines roadmap towards a sustainable EV business.

There are both early movers and those that are yet to take a call as far as navigating into EV is concerned. Bharat Forge, for instance, has been investing into companies in EV space and is also looking for investing in electronics and embedded system. Samvardhana Motherson Group is already making electric wiring for trucks and buses, apart from supplying parts to Mahindra Reva and mirrors to Tesla. Component makers understand that investing in EV component technology and capacity is a matter of survival. Once the shift happens, huge numbers of current components will become obsolete. InfraInsights sees that the recent slowdown in the auto industry has pushed Government to go slow on EV ambition but by no means it will shelve its EV plans and hence the breather provided by Government should be taken as the advantage for auto component OEMs to accelerate their preparedness for the successful EV strategy & implementation. InfraInsights through its research aims to provide a playbook that will be useful for auto-component manufacturers that are at various stages of carving out a successful strategy to stay relevant in the inevitable EV regime.

Table of Contents
  1. Executive Summary
  2. Approach & Methodology
  3. EV in India: Roadmap, Progress, Roadblocks
  4. Decoding the Impact of EVization on Auto Component OEMs
  5. IC 2 EV: Roadmap, Progress & Roadblocks
    1. Auto OEMs
    2. Auto Component OEMs
  6. As-Is Analysis of the Auto Component OEM
    1. Overall business and business portfolio of Large, Medium and Small auto component OEM
    2. Evaluating the existing manufacturing & sourcing capabilities
    3. Evaluating the existing clientele / Supplying to OEMs in 2W, 3W, PV & CV
    4. Evaluating the existing business model – Direct to Auto OEM, Direct to Large auto component OEM, Contract Manufacturing, catering to the domestic market and/or overseas
  7. Quantifying the impact of EVization on the auto component OEMs
    1. Risk of obsolescence to the different products in the product portfolio; identifying what’s immune to EVization and what’s likely to become obsolete eventually
    2. Pace at which OEMs to which company is supplying ICE components are EVizing their product portfolio
    3. Understanding what other auto component OEMs are doing to remain immune from disruption
  8. EVization in India – Optimistic, Realistic & Pessimistic Scenario
    1. Estimating IC to EV Mix in Overall Automobile Sales till 2030 for 2W, 3W, PV and CV
    2. EV Roadmap of different Auto OEMs in India in 2W, 3W, PV & CV
    3. EV components sourcing strategy of Auto OEMs
  9. Government Regulations & Policies to Support to Auto component OEMs in EV Transition
  10. Factors Influencing change in ICE
    1. Shift in ICE technology in BSVI regime
    2. Migration to 48V architecture
    3. CAFÉ norms influence
    4. Shift from alternator & generator to ISG etc.
  11. Right Sizing the ICE Portfolio for the auto component OEM
    1. Demand: Product demand linked to transmission, electrical, engine and the underlying demand for each of these
    2. Supply Competitiveness: capacity vs capacity utilization for each product which will indicate supply absorption velocity and how it has performed over recent 2-3 years
    3. Sustainability: Future of demand for mother part of the vehicle that uses subcomponents manufactured by the company
    4. Technology Innovation in ICE: Relevance of product in the new ICE landscape that will be focused on improved fuel efficiency and least possible emission, shift in fuel to BSVI
  12. Evaluating right fit EV portfolio for the auto component OEM
    1. Estimating the demand for different EV components [Power Train, Battery, Control Gear, Battery Management System, etc]
    2. Shortlisting the EV product portfolio for auto component OEM
    3. Basis demand and supply
    4. Basis indigenous supply vs imports
  13. Go-To-Market Blueprint
    1. Indigenous Manufacturing
      1. Existing capability
      2. Augmentation of capability
    2. Supply Chain
      1. Domestic sourcing
      2. Overseas sourcing
    3. Potential Opportunity Sizing
    4. Potential Target Market Segment; e-rickshaw, e-2W, e-3W, e-PV, e-CV
      1. OEM
      2. After Market
  14. Strategic Partners for successful IC 2 EV migration
    1. Sourcing
    2. Joint Manufacturing
    3. Trading route
    4. Others
Value Propositions
We create value for our customers by amalgamating deep functional and energy industry expertise. Our solutions range from in depth research reports to advisory services enabling our customers with energy market insights to take informed decisions, grow and improve on their competitiveness. Leveraging our breadth of geographical reach we provide solutions in entire energy value chain be it coal, power, oil and gas or renewable. We are a reliable and efficient source comprising of best in class talent pool which provides answer to all the challenges of the energy industry
Request Flyer

Please contact us at info@infrainsights.com for the flyer

Published Reports

Plastic Waste to Oil: Evaluating an Inevitable, Game Changing Business Opportunity, Awaiting to Unfold in India

September 20, 2023 admin No Comments
Overview of Reports
Table of Contents
Value Propositions
Request Flyer
Overview of Reports

According to UN estimates, every year the world uses 500 billion plastic bags while half of the plastic used is of single use or in disposable items such as grocery bags, cutlery and straws. Each year, at least eight million tonnes of plastic end up in the oceans, the equivalent of a full garbage truck every minute. Efforts are on around the world, to mitigate impacts of plastic pollution. China recently moved to ban the import of 24 types of solid waste including plastic. Britain’s 25-year environment plan launched by Prime Minister Theresa May this January has a specific target of eliminating avoidable plastic waste by 2042. Norway not only recycles all of its plastic, it also imports waste from other countries to run its waste-to-energy incineration plants.

India’s struggle with plastic is evident from the fact 70% of total plastic consumption is discarded as waste. Size of plastic industry in India is estimated to be INR 110,000 crore, with over 30,000 plastic manufacturing units supplying over 13 million tonnes of plastic per year, of this nearly 9 million tonnes ends up as waste and of this nearly 60% is estimated to be re-cycled. As per an estimate around 9.5 MTPA of plastic waste is generated in country, which aggregated to about 25,940 TPD. As per a study – Assessment and Quantification of Plastic Waste Generated in 60 Cities – published by the Central Pollution Control Board (CPCB), there is little or no processing of either Municipal Solid Waste (MSW) or plastic waste (PW) in most Indian cities and the metropolises, barring Ahmedabad and Pune, to some extent. According to the study, it is dumped at the disposal site, following the method of crude dumping, where the waste is neither spread nor covered. Across eight metro cities, Kolkata generated 116.79 kg of plastic waste per MT of total Municipal Solid Waste, followed by Delhi (102.98kg/MT of MSW) and Ahmedabad (105.07kg/MT of MSW). While no post treatment operation of MSW or PW was performed in either Delhi or Kolkata, Ahmedabad was placed better with efforts being taken to treat organic waste and reduce MSW in landfills using a gas-based power plant.

If cannot be handled, strategy to reduce the plastic waste generation is in as many as 18 states across India, where a blanket ban on single use plastic is imposed. After India’s capital city of Delhi, Maharashtra, India’s second most populous state, which produces plastic products worth Rs. 500 billion, notified a state-wide a ban on most single-use plastics in April 2018. In March 2016, the erstwhile Plastic Waste (Management and Handling) Rules 2011 were replaced by the Plastic Waste Management Rules 2016, notified by the Ministry of Environment and Forest & Climate Change (MoEF&CC). This provides a regulatory framework for management of plastic waste by urban local bodies as well as the waste generators (individual household, institutions, residential and commercial establishments and defence establishments).The government has notified the Plastic Waste Management Rules, 2016, which regulate manufacture, sale, distribution and use of plastic carry bags including those of compostable plastic, and plastic sheets for packaging or wrapping applications.

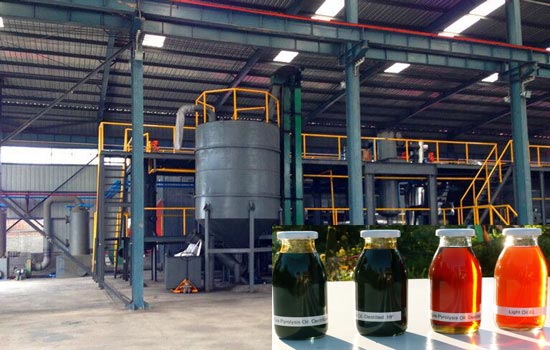
Amongst various techniques and methodologies used for recycling plastic waste, plastic waste to fuel oil (P2F)will be a big game changer for the urban local bodies managing plastic waste and the overall economy at large, this given that India depends on imports for most of its crude oil requirements. P2F is achieving commercialization in various developed markets and with every passing day the technology is maturing even in India market. Over the 4-5 years, conversion of plastic waste to fuel has been talked about and multiple small sized plants have been installed in India, some has met with failure while some have become example of how to get the concept as well as business right India has multiple demonstration projects. Unlike biofuel, where one has to grow the feedstock that is eventually converted into fuel, in case of plastic to fuel, there is abundance of feedstock readily available only the supply chain needs to well managed and the market for the product needs to be enabled through regulatory push. The push towards PW2F is inevitable and it will be enabled by government aid as well, anticipating the emerging dynamics, even large companies will emerge in this opportunity that will build scale and accelerate Industrialization of PW2F, residue of which can easily replace fuel oil used by industrial boilers, gensets etc. InfraInsights research report “Plastic Waste to Oil: Evaluating Multibillion Business Opportunity Awaiting to Unfold”, aims to provide a indepth perspective on the opportunity and a business plan to take informed “Go-No Go” decision.

Table of Contents
  1. Overview on Plastic & Plastic Waste in India
    1. Plastic Production Landscape in India
    2. Plastic Waste Generation in India
      1. Metro, Tier 1 and Tier 2 Cities
    3. Plastic Waste Handling in India
      1. By Municipal Bodies [Across Metros, Tier 1 & Tier 2 Cities]
      2. Case studies
    4. Plastic Recycling & Re-use in India
      1. By Public Sector
      2. By Private Sector
      3. Others
    5. Methods & Techniques deployed for recycling and re-use of plastic in India
  2. Regulations & Policies Driving Plastic Waste Recycling & Re-Use
    1. States / Cities where plastic use are banned or will be banned
    2. Directives given to private and public sector on recycling and reuse of plastic as against dumping in open
  3. Smart Cities Plastic Waste Management Practices
  4. About Plastic to Fuel Technology
    1. Pyrolysis of plastic (polyethylene & polypropylene) [process flow chart]
    2. Machines / Equipment
    3. Grades of plastic that can be converted / cannot be converted
    4. Mobile reactor vs bulk production plant
    5. Quality of Fuel
  5. Plastic to Fuel in Developed Markets
    1. Success & Failures
    2. Lessons to be learnt
  6. Plastic to Fuel in India: Journey So Far
    1. Introduction of the technology in India
    2. Early demonstration plants [Indian Institute of Petroleum under aegis of CSIR
    3. Plants achieved full commercialization
      1. Public Private Partnership
      2. Public
      3. Private [Uflex, Ventana, Ramky and other]
      4. CSR
    4. Early Success and Failure Case Studies
      1. Detailed profiling of capacity, supply chain, output quality, price, market and monetization
  7. Plastic to Fuel in India: Journey Ahead
    1. Municipalities: P2F announcements, plans and budget blueprint by major urban local bodies in India [Focus on metros, tier 1 cities (Indore, Raipur, Bhubaneshwar, Pune etc..]
    2. Refiners like RIL, IOCL, BPCL
    3. Plastic Producers
  8. Estimating Volume Potential of Oil Production Under PW2F by 2030
    1. Optimistic Scenario
    2. Pessimistic Scenario
    3. Realistic Scenario
  9. Plastic to Fuel Market Key Stakeholders
    1. Supplier of Waste Plastic
    2. Supplier of Technology
    3. Quality Testing of Produce
    4. End User Industries
  10. Plastic to Fuel Technology & EPC Supplier in India
    1. PolyCycl Pvt. Ltd
    2. ANZ India
    3. Clean Oceans International
    4. SAMKI Group
    5. Ramky Environment & Others
  11. Permits and Clearances Required to Set-up Plastic to Fuel Plant in India
    1. Land Acquisition
    2. Different regulatory clearances like MoEF, Pollution Control Board etc..
    3. Timeline of each clearances and respective agencies for clearances
    4. Go – No Go zones where these can / cannot be setup
  12. End use sectors that can use P2F product
    1. Industrial Boilers
    2. Brick Kiln etc
    3. Generators
    4. Diesel based Agriculture Pumps etc
  13. Estimating projected market for PW2F reactors / process equipment in India?
  14. Business Models Prevalent in India
    1. Collection – Storage – Processing – Centralize & Decentralize production – localized and mass marketing
  15. Business Plan for a P2F Project in India
    1. Cost [Capex & Opex ]
      1. Land, Plant & Machinery, Commissioning etc
      2. Raw Material, Additives, Agents, Labour, Electricity, Other Utilities
      3. Packaging & Transportation
    2. Financing [Equity, Debt, Subsidy, Taxation etc]
    3. Revenue
    4. Project Viability [Equity Pay Back, Equity IRR, DSCR, Net Profit Margin
  16. Location Best fit for P2F Project Set-up
  17. Factors for and against P2F
  18. Go – No Go Recommendations
Value Propositions
We create value for our customers by amalgamating deep functional and energy industry expertise. Our solutions range from in depth research reports to advisory services enabling our customers with energy market insights to take informed decisions, grow and improve on their competitiveness. Leveraging our breadth of geographical reach we provide solutions in entire energy value chain be it coal, power, oil and gas or renewable. We are a reliable and efficient source comprising of best in class talent pool which provides answer to all the challenges of the energy industry
Request Flyer

Please contact us at info@infrainsights.com for the flyer

Published Reports

Setting up EV Charging Stations in India: Evaluating Top Locations / Clusters in India, Best Fit Business Model and Services

September 20, 2023 admin No Comments
Overview of Reports
Table of Contents
Value Propositions
Request Flyer
Overview of Reports

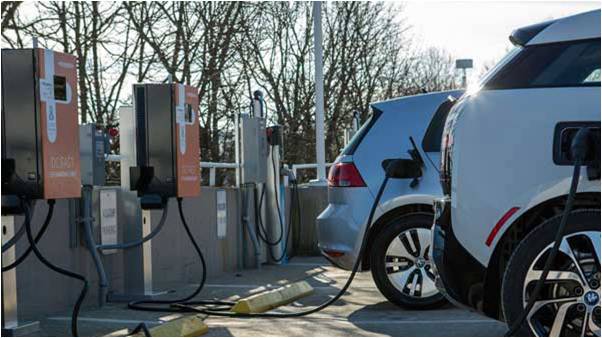
The potential investors in electric vehicle charging business opportunity in India are in a fix, this as they are unsure of whether to put charging stations upfront or wait for critical mass of EVs before investing any money. It’s a classic chicken and egg situation, however, if one takes a closer look into how the Chinese handled this conundrum, one would realize that the initial thrust came in form creation of public electric vehicle charging stations funded by the government and later came the private investment into the charging infrastructure creation. Currently there are only 150 charging stations in India and anticipating the need, Government of India has set up an ambitious target of setting up one charging station every three km in cities and every 25 km on both sides of highways. The government has de-licensed public charging stations business for electric vehicles enabling individuals to extend such facilities, but at a regulated tariff. Companies like ABB, Acme Industries, Fortum India and a few Dutch firms are actively considering setting up vehicle charging stations. State-run companies like NTPC, GAIL India, Indian Oil Corp and Power Grid Corp have been exploring diversification into electric vehicle charging infrastructure business.

Most of the auto industry has been complaining about the lack of charging support directly discouraging their interest in switching vehicles to electric. There are reportedly 60,000 petrol pumps across the country and more expected to be added and if the infrastructure is used, one doesn’t need to acquire more land space to set up the electric vehicle charging stations, and make better use of the available area. Japanese electronics company Panasonic has planned to set up around one lakh charging station for e-vehicles across 25 top Indian cities. The Japanese company is planning to set up these stations by 2024. These charging stations are expected to power over a million vehicles. Company has planned charging stations across top cities like Delhi, Pune, Bengaluru, Chennai, Amravati, Hyderabad, Gurgaon, Noida and Ghaziabad etc. The charging facilities will be set up at petrol pumps, malls, parking lots etc.

At both Central Government level and State Government level, policy changes are being implemented to pave for accelerated charging infrastructure capacity creation. The state of Uttar Pradesh has become the first in India to formally invite EoIs from companies to set up electric vehicle charging stations. This is the first proposal after the Union Power Ministry issued guidelines over setting up of such EV charging stations in December 2018 to promote the use of battery electric autorickshaws. In March this year, the New Delhi government approved the plan to set up 131 public charging stations in the capital. Also, private firms like Magenta Power are working on EV charging corridor on Mumbai-Pune highway besides other projects. The draft policy of Delhi Government, also mentions that to develop charging infrastructure for electric vehicles in Delhi, the government plans to have charging points at every 3 km and offer a subsidy of 100% (up to Rs 30,000) to set up charging points (for the first 10,000 points) in Delhi. As per the Union Housing and Urban Affairs Ministry statement, several amendments have been made to the Model Building Byelaws (MBBL) 2016 and Urban Regional Development Plans Formulation and Implementation (URDPFI) Guidelines 2014, for establishing a robust Electric Vehicle charging infrastructure.

Akin to solar, InfraInsights anticipates deluge of companies interested in setting up electric vehicle charging stations in India, however one has to be careful about the pace at which one has to accelerate in this business where the rudimentary way of fuel retailing may not work. InfraInsights research report “Setting up EV Charging Stations in India: Evaluating Top Locations / Clusters in India, Best Fit Business Model and Services” aims to provide in-depth view on the possible business opportunity, pitfall and most importantly location level study to help funnel the most attractive pockets / clusters where setting up EV charging stations makes business sense considering the penetration of EV and the time to break even on investment made in charging station.

Table of Contents
  1. Executive Summary
  2. Research Approach & Methodology
  3. EV Charging Stations in India
    1. Trend in y-o-y addition
    2. Location wise spread / concentration
    3. By ownership – private vs public vs community
  4. EV Population in India
    1. Trend in y-o-y addition
    2. Location wise spread / concentration
  5. Government Policy & Regulations Driving EV
    1. Fame II
    2. GST Reduction on EV
    3. Tax Benefit
    4. Duty Reduction
    5. Others
  6. Electric Vehicle Charging Stations Business Model
    1. In India
    2. Leading EV Markets like China, Japan, Nordic countries
  7. Permits & Clearances required to set up EV charging stations in India
  8. Projected EV Population in India by 2030 and its distribution
    1. By Automobile Type – 2W, 3W, 4W, CV
    2. By Region
    3. By Metros
    4. By Location within Metros
  9. Study of EV Station Layouts
    1. In Malls
    2. by motor type (AC, DC)
    3. In IT Parks
    4. In Residential Complex
    5. In Fuel Stations
  10. Components of EV charging station
    1. Land layout
    2. Electrical Equipment & Machinery
    3. Product & service retailing
  11. EV charging stations
    1. Capex, Opex
    2. Operations & Maintenance
  12. Evaluating customer journey in charging vehicle at EV charging stations
  13. Electric Vehicles Charging Stations Business Plan
  14. Charging as a service & different innovative models
    1. Pickup and drop service [overnight charging for individual]
    2. Mobile charging stations
    3. Sourcing criterion
    4. Others
  15. Identifying key clusters across states in India for setting up network of charging infrastructure
  16. Evaluating possible business models
    1. Ownership – network of charging stations
    2. BOOT model in charging stations in Malls, IT Parks etc
  17. Evaluating possible operating models
    1. Like telecom towers
    2. Like unmanned fuelling stations in developed countries
    3. Artificial Intelligence enabled charging stations
    4. Others
  18. Evaluating different services component in charging business
    1. Billing & Collections
      1. Pre-Paid cards
    2. Charging stations availability app
    3. MRO of charging stations
  19. InfraInsights GTM Insights
Value Propositions
We create value for our customers by amalgamating deep functional and energy industry expertise. Our solutions range from in depth research reports to advisory services enabling our customers with energy market insights to take informed decisions, grow and improve on their competitiveness. Leveraging our breadth of geographical reach we provide solutions in entire energy value chain be it coal, power, oil and gas or renewable. We are a reliable and efficient source comprising of best in class talent pool which provides answer to all the challenges of the energy industry
Request Flyer

Please contact us at info@infrainsights.com for the flyer

Published Reports

Evaluating Multi-billion Opportunity in Solid Waste Management in India across Urban Local Bodies and Commercial & Residential Setups

September 20, 2023 admin No Comments
Overview of Reports
Table of Contents
Value Propositions
Request Flyer
Overview of Reports

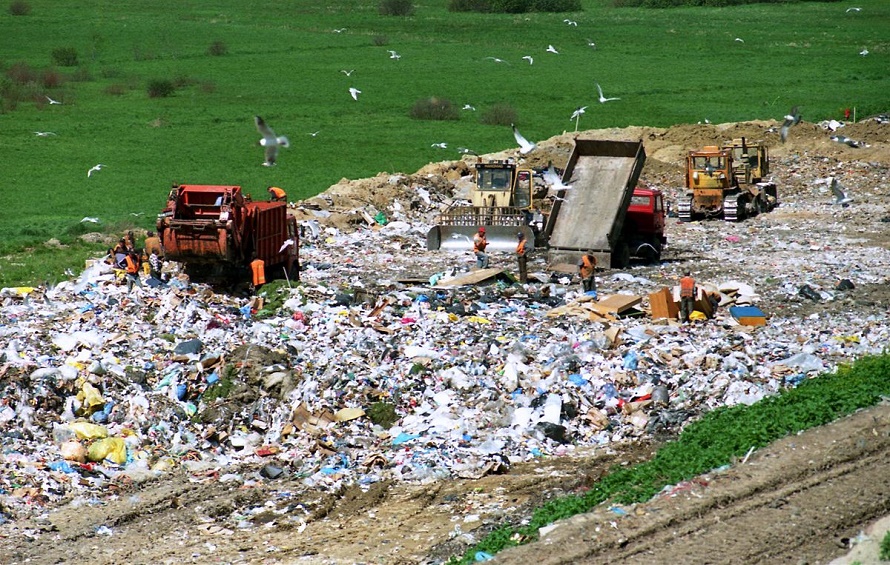
India is well on its course to achieve its objective of electricity for all, and one can expect the goal to be achieved by 2019 or by 2020. After electricity, water is most important utility service which will need tremendous attention of the government, India is blessed with several rivers but that’s under threat due to climate change and India is already declared as water stressed country. After water, waste management will become the most important area for the government, as currently almost all cities are facing enormous challenge in effectively dealing with solid waste management. With growing population and rapid urbanization, waste generation in India has increased significantly over the last decade. More than 70% of collected urban waste is dumped at landfills. And most of them are brimming. It has also been estimated that annual waste generation will likely increase to 165 million tonnes by 2030. This means that 66,000 hectares of land will be required to set up a landfill site that is 10 meters high and can hold 20 years’ worth of waste. To put things in perspective, that is almost 90% of Bengaluru’s area. If the current waste management scenario does not improve, one can soon expect to be buried in our own muck. Almost all the Municipalities are struggling to effectively manage waste generated across different cities. MCGM, is staring at brimming landfills, fire related issues in landfills, lack of processing capacities and as a result has resorted to force citizen participation in solid waste management. MCGM, has decided not to pick solid waste for societies / complexes, of more than 20,000 square meters or those producing more than 100kg wet waste per day. The Brihanmumbai Municipal Corporation (BMC) has issued notices to 23,161 housing societies for not following the mandatory rule, leaving citizens in lurch for no mistake of theirs. Had BMC implemented the SWM Rules 2000, by now it would have had effective and efficient solid waste management capabilities in place. Data represented in the chart below indicates how garbage is overflowing in almost all landfills across the country. Farm Chart

According to data gathered by the Central Pollution Control Board (CPCB), municipal authorities in India had established only 13 waste-to-energy plants, 56 bio-methanation plants, 22 refuse-derived fuel plants and 553 compost and vermicompost plants until 2014. However, more treatment and processing plants need to be built to realize the true potential of solid waste. According to the Planning Commission, municipal solid waste that is not utilized has the potential to produce 439 MW of power from 32,890 tons per day of combustible waste. This includes refuse-derived fuel, 1.3 million cubic meters of biogas per day and 5.4 million metric tonnes of compost (all annual) that can be utilized for agricultural purposes. InfraInsights sees waste management as a multi-billion dollar opportunity for private sector as the public sector finds itself in spot when it comes to effective waste management. ULBs will seek participation of private sector and its citizens to help deal with the challenge of burgeoning solid waste in almost all cities across the country. It’s inevitable that decentralized approach to waste management will lead to capacity creation at community level as well as centralized level in ULBs. Sanitary landfills is no more a viable option for mega cities like Mumbai, Bengaluru, Chennai & others, and hence technology will have to leveraged to effectively and efficiently, reduce, recycle, re-use waste. Demand for semi-automatic or fully automatic composting machine is likely to increase in the residential societies and demand for WTE, Biomethanization, RDF setups are slated to increase across ULBs. Private sector, whether directly or indirectly will play a very important role in partnering with ULBs, Municipalities to shoulder the burden of waste management through technology. InfraInsights research report “Evaluating Multi-billion Opportunity in Solid Waste Management in India across Urban Local Bodies and Commercial & Residential Setups”, aims to quantify the business opportunity that waste management as a segment will generate for private sector and companies in the area of public utility services business are expected to immensely benefit out of this demand. Technology providers will see demand from ULBs and Residential societies alike. The report will do a detailed profiling of all the major ULBs in countries to understand its capabilities, gap areas, cost efficiency / inefficiency, budgets, technology deployed, forthcoming project for capacity creation and O&M, to help companies in private sector, draw out its growth strategy in this very critical segment of waste management. Report will be primary research driven, and the analysis and insights will be presented in a manner that it can be leveraged by companies for its business planning in the area of solid waste management.

Table of Contents
  1. Executive Summary
  2. Research Approach & Methodology
  3. Solid Waste Management (SWM) Landscape across ULBs, Residential & Commercial Setups
    1. Size & Scale
    2. Typical Waste Profile
    3. Stakeholders
    4. Value Chain
    5. Evolution of waste management
  4. Regulation & Policies Governing SWM in India
    1. Solid Waste Management Rules 2016
    2. Municipal Solid Waste Rules, 2000
  5. Current State of Municipal Solid Waste Management (MSWM) in India
    1. Waste Generation
      1. Share of States & UTs in Urban MSW
    2. Type of Waste
    3. Per Capita Waste Generation
    4. Waste Collection
    5. Waste Disposal
    6. Issues & Challenges
  6. Current State of Solid Waste Management in Commercial Institutions
    1. Airports
    2. Hotels
    3. Malls
    4. Railways
  7. Current State of Solid Waste Management in Residential Complexes / Institutions
    1. Waste Seggregation at Source
    2. Waste Treatment & Disposal
      1. Methodology & Technology Deployed
    3. Typical cost profile – Capex & Opex
  8. Waste Disposal Methods Deployed by ULBs
    1. Landfills
    2. Compost
    3. RDF
    4. WTE
  9. Detailed Profiling of Waste Management across 20+ ULB / Municipalities / Nagar Nigams in India; NDMC, MCD, MCGM, SWM, BMC, Luck now MC, PMC, Nagpur, Indore, Jaipur etc..
    1. Overall Population
    2. Waste Generation & Waste Profile
    3. Waste Management
      1. ULB
      2. PPP
    4. Per Capita Waste Generation
    5. Waste Collection
      1. Collection efficiency
    6. Waste Processing & Disposal Methodology
      1. % of waste treated & disposed
      2. % waste disposed without treatment in landfill etc.
    7. Number of landfill sites
    8. Number of processing plants & capacities
    9. Issues & Challenges
    10. Manpower deployed, infrastructure deployed, technology deployed in
      1. Waste Collection
      2. Waste Transportation
      3. Waste Processing & Disposal
  10. Trend in Allocation for SWM in Annual Budgets across States
    1. Average Expenditure on SWM as part of Total Revenue Expenditure of a Municipality / Municipal Corporations
    2. Planned Revenue Expenditure
    3. Planned Capital Expenditure
    4. Plan vs Actual
    5. Budget Financing Sources – Grants etc
  11. Benchmarking Cost of SWM across Urban Local Bodies in India
    1. Cost structure (by value chain)
      1. % of total cost in waste collection
      2. % of total cost in waste transportation
      3. % of total cost in waste processing & disposal
    2. Cost structure (by expense heads)
      1. Establishment & Salaries Cost
      2. O&M Cost
        • Transportation
        • Other O&M including consumables
        • Contingency
      3. Other Contractual Cost
    3. Cost Recovery
      1. Fee collected from waste generators like residential complexes, commercial setups etc..
    4. Revenue (sales of Refuse derived fuel (RDF), Compost, trade refuse etc..)
    5. Overall Cost Per Ton of Waste
  12. Best Practices in Solid Waste Management in Residential & Commercial Institutions
    1. Waste Collection, Seggregation, Treatment / Processing & Disposal
      1. Technology Deployed – composting or bio methanization
      2. In-house vs outsource
      3. BOOT, BOO
      4. Case studies
  13. Global Case Studies on Waste Management in Developed Countries
    1. US
    2. France
    3. Japan
    4. China
    5. UK
  14. Private Sector Participation in SWM in India
    1. Level of Private Sector Participation
    2. Contractual Models
      1. Service Contrac
      2. Management Contract
      3. DBO
      4. Lease
      5. BOO
      6. BOOT
      7. Concession
    3. Case studies on private sector participation
      1. Burhat Bengaluru Mahanagar Palika (BBMP)
      2. Greater HMC
      3. Ahmedabad Municipal Corporation
      4. Chennai Corporation
  15. Solid Waste Management in Smart Cities
  16. Extrapolating Waste Generation across cities by 2030
  17. Overview on Future Strategy by ULBs for efficient and effective Waste Management
  18. Detailed Profile on Planned & Proposed Capex and O&M Contracts in Solid Waste Management by ULBs
    1. Waste Collection
    2. Waste Transportation
    3. Waste Process & Disposal
      1. Biomethanization
      2. WTE
      3. RDF
      4. Composting
  19. Pan India Survey on Evolution of Waste Management at Community level
    1. Understanding Awareness
    2. Understanding Willingnes
    3. Understanding Waste Management Experience
  20. Opportunity in Community Level Waste Management in India
    1. Estimating demand for Semi-Automatic & Automatic Composting Machines
    2. Estimating demand for Biomethanization plants in commercial complexes like Hotels, Airport, IT Parks etc..
    3. Estimating demand for W2E
    4. Market Size for Composting Machines
  21. Residual Fuel Market Opportunity in India
    1. Current Processing Capacities
    2. Current End User Industrie
    3. Projected Demand for RDF by 2030
  22. Waste Processing Technology Providers in India
    1. Technology Variants & Adoption
    2. Pricing
    3. O&M expenses
Value Propositions
We create value for our customers by amalgamating deep functional and energy industry expertise. Our solutions range from in depth research reports to advisory services enabling our customers with energy market insights to take informed decisions, grow and improve on their competitiveness. Leveraging our breadth of geographical reach we provide solutions in entire energy value chain be it coal, power, oil and gas or renewable. We are a reliable and efficient source comprising of best in class talent pool which provides answer to all the challenges of the energy industry
Request Flyer

Please contact us at info@infrainsights.com for the flyer

Published Reports

Multi-billion dollar opportunity for project & services in water & waste water treatment industry in India: What is the next Oil!

September 20, 2023 admin No Comments
Overview of Reports
Table of Contents
Value Propositions
Request Flyer
Overview of Reports

Water is the next oil?! Water will become more valuable than oil as rising demand from people, industries and agriculture puts pressure on supplies, according to the chief executive of French utility Suez. And it’s evident when one does a deep dive into reports by multi-laterals on why India could soon be staring at water crisis. Hence the need to conserve water is growing by every passing day and hence water recycling is slated to become inevitable across all water guzzling metros in India. India’s biggest problem is its over-dependence on the monsoon. Just 60 per cent of the country receives irrigated water. The rest of the land is dependent on monsoon rains. The major problem here though is that India has not invested in irrigation for decades. Though investment in irrigation is rising, it will take years for the country to reduce its reliance on the monsoon. Even if it does this, the country also has to deal with the problem of water wastage with rainwater harvesting struggling to become popular in many parts of urban India. In non-urban areas, poor water management, deforestation and unchecked development are not allowing water bodies to be sufficiently regenerated.

Many cities in India are already water starved and it’s because of one own wrong doings or instead let’s put other way round that we have been more ignorant towards this scarce resource which is almost available for free. There are three ways to overcome this crisis in the cities: reduce wastage, store rainwater and recycle used water. The potential of water recycling to meet non-potable needs such as for gardening, toilet and laundry, which accounts for at least 60 per cent of domestic water, use is huge. In fact, Brisbane, Singapore, Windhoek (Namibia) and California’s Orange County are recycling waste water for drinking. While the use of sewage for potable purposes is still to pick up in a big way globally, its use for non-potable ends worldwide is far more common.

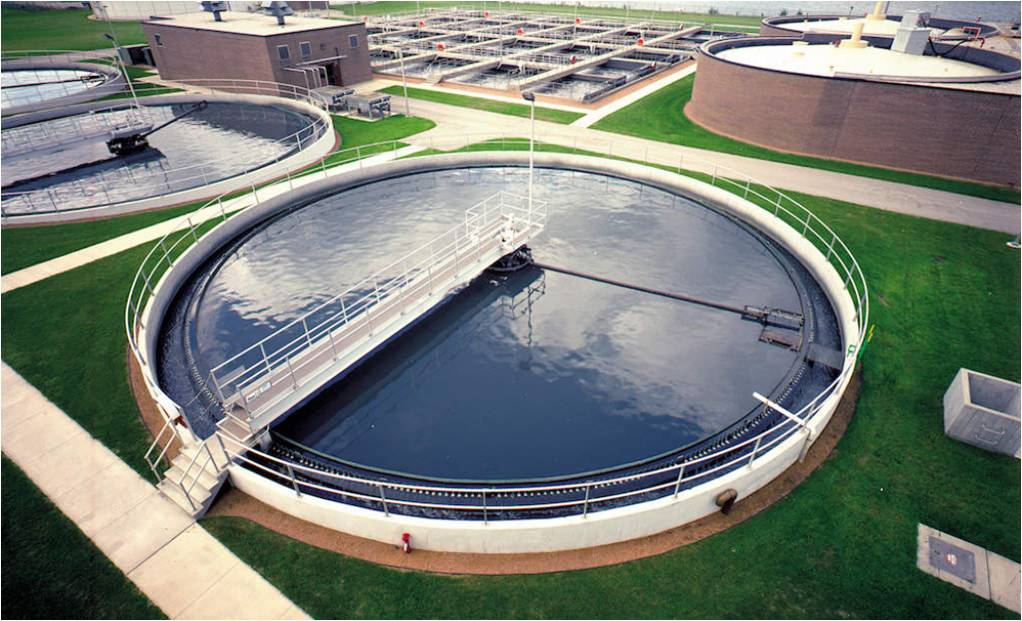
In Bengaluru, out of 1,600 million litres of day (MLD) of sewage that the city generates (about 80 per cent of water consumed is wastage), only about 600 MLD is treated by about 25 plants set up by the BWSSB as well as by apartment complexes, the total installed capacity being about 1,500 MLD. Of this 600 MLD, no more than a tenth is reused. For instance, the Yelahanka tertiary treatment plant supplies water for non-potable uses to the Kempegowda International Airport and a few other institutions. Most treatment plants treat water till the secondary stage, making it fit for discharging into the lakes or for certain industrial uses such as cooling. In Delhi, the situation is better on paper. A consumption of 3,420 MLD leads to waste water of over 2,600 MLD, of which 1,600 MLD is treated and 338 MLD is reused. However, that does not really explain why the Yamuna is such a dirty river. The Delhi government concedes that the low flow of sewage in STPs, and trunk and peripheral sewer lines still to be connected to them has impeded the effectiveness of sewage treatment. The waste water treatment scenario is much worse in Mumbai. According to officials in the Municipal Corporation of Greater Mumbai, out of 3,750 MLD supply, 2,300-2,400 MLD goes into the sea, almost untreated. MCGM officials claim that its seven STPs are working. Tenders have been placed for six sewage treatment plants, which will treat 2,600-2,700 MLD. Construction is expected to commence in October.

InfraInsights sees water sector becoming the next multi-billion opportunity on both new project as well as R&M of existing capacities and hence this report aims to quantify the opportunity through extensive primary research. The report will be indispensable source of information & insights for companies operating in the water & waste water treatment space as well as companies that want to enter this very promising sector which while currently seen as largely controlled by government, will soon see a sea of change that will have larger private sector participation

Table of Contents
  1. Executive Summary
  2. Approach & Methodology
  3. Water & Waste Water Treatment Market Landscape
    1. Key Stakeholders & their role
      1. Suppliers
      2. Channel
      3. End User
      4. Pollution Control Board
  4. Water & Waste Water Treatment Capacity in India
    1. Water consumption
    2. Sewage Generation
    3. Treatment Installed capacity
    4. Capacity Gap
  5. Products & Technologies Used in water treatment, ETP, STP and water recycling
    1. Type of Treatment
      1. Primary
      2. Secondary
      3. Tertiary
  6. Overview on OEMs in Water Treatment Segment
    1. Classification based on operations
      1. Large
      2. Medium
      3. Small
    2. Classification based on ownership
      1. Domestic Firms
      2. International Firms
      3. JVs
    3. Offerings of OEMs
    4. Key selling practice of OEMs
    5. Services provided by key OEMs
    6. Business model of OEMs
  7. Water treatment project execution landscape
  8. Regulatory landscape governing water and waste water treatment industry in India
  9. Market Size Estimate 2017-18
    1. Market by type of projects
      1. Water recycle
      2. STP
      3. Water Treatment
      4. ETP
    2. By type of business
      1. Project
      2. Product
      3. Services / Spares
    3. Market by segments
      1. Commercial
      2. Community
      3. Industrial
    4. Market by region
      1. West
      2. East
      3. North
      4. South
    5. Market by players
      1. Small & Unorganized
      2. Medium OEMs
      3. Large OEMs
    6. By type of product
      1. Retrofit & Augmentation
      2. Standard Products
    7. By type of services
      1. Spares
      2. VAS
      3. VAS
      4. O&M
  10. Component Industry Structure
    1. Components supplied
      1. Pumps
      2. Valves
      3. Membranes
      4. Membrane housings
      5. FRP Vessels
      6. Resins
      7. Pressure Tubes
  11. Market estimate by components in 2017-18
    1. By products – Filters, Dosing Pumps etc
  12. Water treatment & recycling needs of different industries
    1. Power
    2. Steel
    3. Refinery
    4. Textiles
    5. Chemicals
    6. Hospitals
    7. Pharma
    8. Food & Beverage
    9. Commercial
    10. Municipality
  13. O&M cost of water treatment & recycling across different industry segment
    1. Operations Cost
    2. Maintenance Cost
    3. Total Cost of treated water
  14. End user industry view on different OEMs
    1. Reach
    2. Design Capability
    3. Product Range
    4. Quality
    5. Equipment Make
    6. Job Execution Capacity
    7. Price
    8. O&M contract
    9. AMC
  15. Need Gap analysis of end user industry
    1. Need Gap
    2. Spend levels
    3. Service expected
  16. Water Utility O&M Trend in in-house vs outsourcing
  17. Key demand drivers of water and waste water services in India
    1. Investment in industrial, commercial & community projects
    2. Servicing of existing water treatment & recycling units
      1. Services, Retrofit and augmentation among the existing units
      2. Demand from end user
  18. Projected market for services in water and waste water treatment in India by 2024-25
    1. New Project Demand
      1. Investments across end user segment
      2. Norms on spend on water and waste water treatment in greenfield projects
      3. Norms on spend on services as % of project cost at a segment level
      4. Likely growth rate in water and waste water treatment projects expected
    2. Services, Spare and AMC Demand
  19. Overall GTM
    1. Spares
      1. Water Utility O&M
      2. Retrofit & Augmentation
Value Propositions
We create value for our customers by amalgamating deep functional and energy industry expertise. Our solutions range from in depth research reports to advisory services enabling our customers with energy market insights to take informed decisions, grow and improve on their competitiveness. Leveraging our breadth of geographical reach we provide solutions in entire energy value chain be it coal, power, oil and gas or renewable. We are a reliable and efficient source comprising of best in class talent pool which provides answer to all the challenges of the energy industry
Request Flyer

Please contact us at info@infrainsights.com for the flyer

1 2 3 … 7

Recent Report

  • Renewable Energy Markets Competitiveness in India: Best States for Investments in Renewable Energy Sector in India September 20, 2023
  • InfraInsights Research Report on LPG Market in India by 2030: Statewise and District Wise Monthly Sales of LPG by OMCs and PMCs September 20, 2023
  • WASTE TO ENERGY OPPORTUNITIES IN INDIA September 20, 2023

Categories

  • Published Reports64
  • Upcoming Reports5

InfraInsights is an independent business information and market analysis company that assists companies in the infrastructure industry through independent fact-based insight, ensuring their business success today and tomorrow.

Phone : +91-87798-38473
E-mail : info@infrainsights.com

Company

  • About Us
  • Clients
  • Careers
  • Contact Us

SERVICE OFFERING

  • Report
  • Research
  • Consulting
  • Analytics
  • Databases

Our Newsletter

Get in your inbox the latest News

Copyright © 2023 Infrainsights, All Rights Reserved.| Developed by WTS