Skip to content
InfrainsightsInfrainsightsInfrainsights
  • Home
  • About Us
  • Service Offering
    • Report
    • Research
    • Consulting
    • Analytics
    • Databases
  • Newsletter
    • Daily Newsletter
    • Weekly Newsletter
  • CLIENTS
  • CAREERS
  • Contact Us

Category: Upcoming Reports

Infrainsights > Upcoming Reports
Upcoming Reports

Renewable Energy Markets Competitiveness in India: Best States for Investments in Renewable Energy Sector in India

September 20, 2023 admin No Comments
Overview of Reports
Table of Contents
Value Propositions
Request Flyer
Overview of Reports

The emerging technical, economic, political, policy and several other market factors pertaining to renewable energy sector in India, entails detailed evaluation is undertaken by investors keen in investing in India renewable energy growth story before committing investments. Attractiveness associated with investing in renewable energy in India varies from state to state and hence it is important to benchmark critical factors that make any market attractive or not so attractive for investments in renewable energy. InfraInsights through its research report “Renewable Energy Markets Competitiveness in India: Best States for Investment in Renewable Energy Sector in India” aims to provide investor community (PEs, VCs, Investment Banks, Project Financiers, Promoters, Banks, NBFCs, Companies) both in India and outside, a detailed benchmark of factors that differentiates state that leads in renewable energy investment vis-à-vis the laggards. The report will benchmark each state on 9 parameters and each of these parameters will be scored over a scale of 1 to 10 (1 = lowest, 10 = highest) for performance of renewable energy on respective parameters in the half year of the fiscal year in consideration and the projected performance for the same half year of the next fiscal year; first report will cover H2 FY23-24 and H1 FY24-25.

The intent is to provide one of its kind robust frameworks that will measure the development of Renewable Energy Market Competitiveness Intensity (REMCI) across different states of India that are witnessing traction and are likely to witness traction in terms of investment in renewable energy. The REMCI Index will reflect how attractive a particular renewable energy market in India is to new investor in terms of the competitive environment. RE-MCI framework will comprise of nine parameters grouped into three broad clusters: Market framework, Supply Market Maturity, Demand Market Maturity. Each of the nine parameters will be rated across the scale to allow for the comparison of distinct renewable energy markets seen in over 15 states in India. RE-MCI index will measure competitiveness of renewable markets over 15 states across North, South, West, East and North East.

How Renewable Energy – Market Competitiveness Intensity (RE-MCI) Framework will help?

The RE-MCI Framework is designed in mind to help investors, financiers, developers, market regulators, traders, power exchanges gauge the market competitiveness of renewable energy market in a particular state from investment perspective both for existing or new market entrants.

  • The RE-MCI will provide clear view on which states are leaders, which ones are challenger’s leaders, which ones are emerging and which ones are laggards.
  • Provide comparative view on how each state compare with others on each and every parameters across the three broad cluster viz: Market framework (regulation, infrastructure, conducive to technology- topography), Supply Market Maturity, Demand Market Maturity
  • Provide immediate short term outlook on whether the score of states across the parameters within three clusters will improve or drop over a period of one year. Half year of current fiscal vs same half year next fiscal.
  • RE-MCI will be published twice in a year to ensure that development in the markets over a period of six months are reflected and accordingly changes atleast every half yearly.

Overall, the RE-MCI will be a great tool for companies that they can refer to when it comes to either taking an investment call or exit call from renewable energy market of a particular state or in terms of managing the overall renewable energy investment portfolio in India.

This is brief about RE-MCI research that InfraInsights has conceived and a detailed flyer and table of content will be released soon. In order to ensure that we increase the utility of this research product for Industry, we want to hear from you on how we can further better this product for industry utility. The product will be a subscription product and half yearly update will be provided. Each state will have individual analysis module which will provide details on how the state compares with other states on a particular parameter within the three clusters i.e. (Market framework, Supply Market Maturity, Demand Market Maturity)

Table of Contents
  1. Renewable Energy in India: Story So Far
  2. Evolution of Renewable Energy in India
    1. Wave 1: Wind Capacity Blows
    2. Wave 2: SHP & Biomass, Wind Gains Momentum
    3. Wave 3: Explosion of Solar
  3. Stakeholders in Indian Renewable Energy Market
  4. Growth Drivers
    1. Regulatory
    2. Policy
    3. Market Structure
    4. Technology Industrialization & its inroads in India
  1. Growth Barriers
    1. Financing Risk
    2. Technology Prejudice
    3. Inconsistent Policy Support
    4. Effective Implementation of Regulations
  1. Early Pioneers in Renewable Energy
    1. Technology – Wind
    2. State – Tamil Nadu
    3. Company – Suzlon, Tata BP Solar
    4. Industry – Cement & Textiles
  1. Roadblocks to Sustainable Growth of Renewable Energy in India
    1. Lack of Vision / Roadmap
    2. Infrastructure Constraint
    3. Policy Inconsistencies & divergence
    4. Financing Challenges
    5. Regulatory Non Compliance
    6. Lack of Portfolio Approach
  1. Renewable Energy Markets in India: 29 States represents 29 different RE markets in One Country
    1. RE Potential Vs Installed Capacity in each state
    2. State Government Policies across states for Wind, Solar, Biomass and SHP
  1. About the RE-MCI Framework
    1. Introduction
    2. Approach & Methodology
  1. Best States to Invest in Solar (15 States will be analysed over 3 clusters and each parameter under the clusters will be rated over scale of 1 to 10 for current performance and projected year ahead performance. There will be 8-10 page for each state covering 10.1, 10.2, 10.3 and 10.4.)
    1. Market Framework
      1. Policy & Regulatory Framework
      2. Effectiveness of Regulator
      3. Initiative / vision & strategy to attract Investment in Solar
      4. Power Evacuation Infrastructure
      5. Techno-Commercial Constraints & Barriers
    2. Supply Market Maturity
      1. Potential Vs Exploitation
      2. Operational Performance
      3. Market Concentration
    1. Demand Market Maturity
      1. Sustainability of Demand
      2. RPO Compliance Trend
      3. Demand Profile
    1. Benchmarking of all 15 states against 11 parameters (Will represent how a state compare with other state across every parameter states above when compared to remaining 14 states).
  1. Best States to Invest in Wind
    1. Market Framework
      1. Policy & Regulatory Framework
      2. Effectiveness of Regulator
      3. Initiative / vision & strategy to attract Investment in Wind
      4. Power Evacuation Infrastructure
      5. Techno-Commercial Constraints & Barriers
    2. Supply Market Maturity
      1. Potential Vs Exploitation
      2. Operational Performance
      3. Market Concentration
    1. Demand Market Maturity
      1. Sustainability of Demand
      2. RPO Compliance Trend
      3. Demand Profile
    1. Benchmarking of all 15 states against 11 parameters (Will represent how a state compare with other state across every parameter states above when compared to remaining 14 states).
  1. Best States to Invest in Biomass Energy
    1. Market Framework
      1. Policy & Regulatory Framework
      2. Effectiveness of Regulator
      3. Initiative / vision & strategy to attract Investment in Biomass
      4. Power Evacuation Infrastructure
      5. Techno-Commercial Constraints & Barriers
    1. Supply Market Maturity
      1. Potential Vs Exploitation
      2. Fuel Constraints & Operational Performance
      3. Market Concentration
    1. Demand Market Maturity
      1. Sustainability of Demand
      2. RPO Compliance Trend
      3. Demand Profile
    1. Benchmarking of all 15 states against 11 parameters (Will represent how a state compare with other state across every parameter states above when compared to remaining 14 states).
  1. Best States to Invest in Small Hydro Power (SHP)
    1. Market Framework
      1. Policy & Regulatory Framework
      2. Effectiveness of Regulator
      3. Initiative / vision & strategy to attract Investment in SHP
      4. Power Evacuation Infrastructure
      5. Techno-Commercial Constraints & Barriers
    1. Supply Market Maturity
      1. Potential Vs Exploitation
      2. Operational Performance
      3. Market Concentration
    1. Demand Market Maturity
      1. Sustainability of Demand
      2. RPO Compliance Trend
      3. Demand Profile
    1. Benchmarking of all 15 states against 11 parameters (Will represent how a state compare with other state across every parameter states above when compared to remaining 14 states).
Value Propositions

We create value for our customers by amalgamating deep functional and energy industry expertise. Our solutions range from in depth research reports to advisory services enabling our customers with energy market insights to take informed decisions, grow and improve on their competitiveness.

Leveraging our breadth of geographical reach we provide solutions in entire energy value chain be it coal, power, oil and gas or renewable. We are a reliable and efficient source comprising of best in class talent pool which provides answer to all the challenges of the energy industry.

Request Flyer

Please contact us at info@infrainsights.com for the flyer

Upcoming Reports

InfraInsights Research Report on LPG Market in India by 2030: Statewise and District Wise Monthly Sales of LPG by OMCs and PMCs

September 20, 2023 admin No Comments
Target Audience(s)
Table of Contents
Key Questions Answered
Request Flyer
Target Audience(s)
Our target audience is significantly diverse and ranges from thought leadership seekers/market speculators to those looking for an independent intelligence before committing their resources or capital. Our laundry list includes:
 
Target audience Reasons to buy
LPG Import Terminal Developers LPG terminal developers and operators are the gate keepers of imported LPG in India. New investments are being contemplated and decisions under-progress that require independent assessment of market opportunities and sustainability of demand for LPG.
LPG Importers & Suppliers The report gives a clear direction to the importers & suppliers of LPG. India is the 2nd largest LPG importer in the world. Hence, it is crucial to fully understand the market opportunities to make a robust strategy for future business growth.
Oil Marketing Companies and Parallel Marketers The OMCs and PMCs are the enablers and creators of LPG sector in the country. With growth potential and new players coming-in there is going to be a significant competition across the board. With new growth centers and geographical enhancement, whoever makes an early move will be benefitted. The report identifies such opportunities for a period upto 2030.
Cylinder Manufacturers With new demand hubs being created such as rural LPG households as well as favorable scenario for AutoLPG, for the cylinder manufacturers it is the best time to look for M&A and capacity enhancement.
Government Agencies/Policy Makers The report will be vital for the Government and its policy making agencies who have the mandate of achieving the end objective of making India run on Clean Fuels.
Table of Contents
  • Executive Summary
  • Global LPG Market Outlook
    • Demand – Supply trend
    • International LPG/C3 & C4 pricing trend
    • Major LPG hubs
    • India’s footprint on Global LPG map
  • Status of LPG infrastructure & penetration in India
    • LPG Pipelines: Readiness, Regional spread, Capacity and Usage
    • Domestic LPG production capacity: Refineries & Fractionators
    • Growth in number of LPG connections
    • Existing and Emerging (Proposed/Planned/Upcoming) LPG Import Terminals
  • LPG Industry Structure
    • Government Agencies
    • Private Associations
    • Key Public & Private Players
  • Competitive Landscape
    • Mapping key public and private sector players
    • Market positioning and key strengths (including control over supply chain)
  • Snap-shot of present and upcoming Government Policies for LPG Sector in India
  • LPG Price Indexation
    • Competing Fuels – Furnace Oil, Naphtha, HSD-Auto, Petrol, PNG and CNG
    • Competing Segments – Residential, Transport, Commercial and Industrial
    • Imported LPG vs. LNG
  • Evolution of LPG consumption in India
    • Total consumption increase
    • Historic growth trends for LPG consumption
    • Demand drivers of LPG in India
  • Future Outlook on LPG demand (2024-2030), based on
    • Residential Segment
    • Transport Segment
    • Industrial Segment
    • Commercial Segment
  • Existing and Future Outlook on LPG Imports in India (2024-2030)
    • Historic LPG Imports Trend
    • Major international LPG supply destinations
    • Indian Refinery and Fractionator Potential for domestic LPG production
      • Scenario – A
      • Scenario – B
    • Outlook on India’s dependence on LPG imports based on Scenario A and Scenario B vis-à-vis projected demand
  • High-level assessment of adequacy of existing LPG import terminals to meet Demand-Supply Gap
    • Existing LPG import terminal capacity and through-put
    • Opportunity for capacity enhancement or new capacity addition
  • Emerging demand for LPG cylinders (in nos.) and its high-level impact on the entire supply chain of cylinder related manufacturing and imports
  • Overview on overall investment potential in LPG Sector in India
  • Conclusion
Key Questions Answered
  • What is the existing and evolving market size for LPG in India?
  • What is the emerging demand for LPG cylinders in India?
  • What is the existing competitive landscape for LPG sector in India?
  • What are the opportunities for private/parallel marketing companies of LPG in India?
  • What are the new demand centres for LPG in India? Whether the supply & logistics infrastructure in these demand centres adequately developed to sustain future growth?
  • Whether auto manufacturing companies should focus on LPG fitted variants since economics of running on AutoLPG is favourable?
  • Whether LPG has a sustainable future given the fact that India is also pushing for natural gas sector development?
  • What are the immediate infrastructure gaps/bottlenecks in LPG infrastructure?

What is the outlook on overall investment potential in LPG sector in India given the stellar growth in LPG consumption?

Request Flyer

Please contact us at info@infrainsights.com for the flyer

Upcoming Reports

WASTE TO ENERGY OPPORTUNITIES IN INDIA

September 20, 2023 admin No Comments
Overview of Reports
Table of Contents
Key Questions Answered
Value Propositions
Overview of Reports
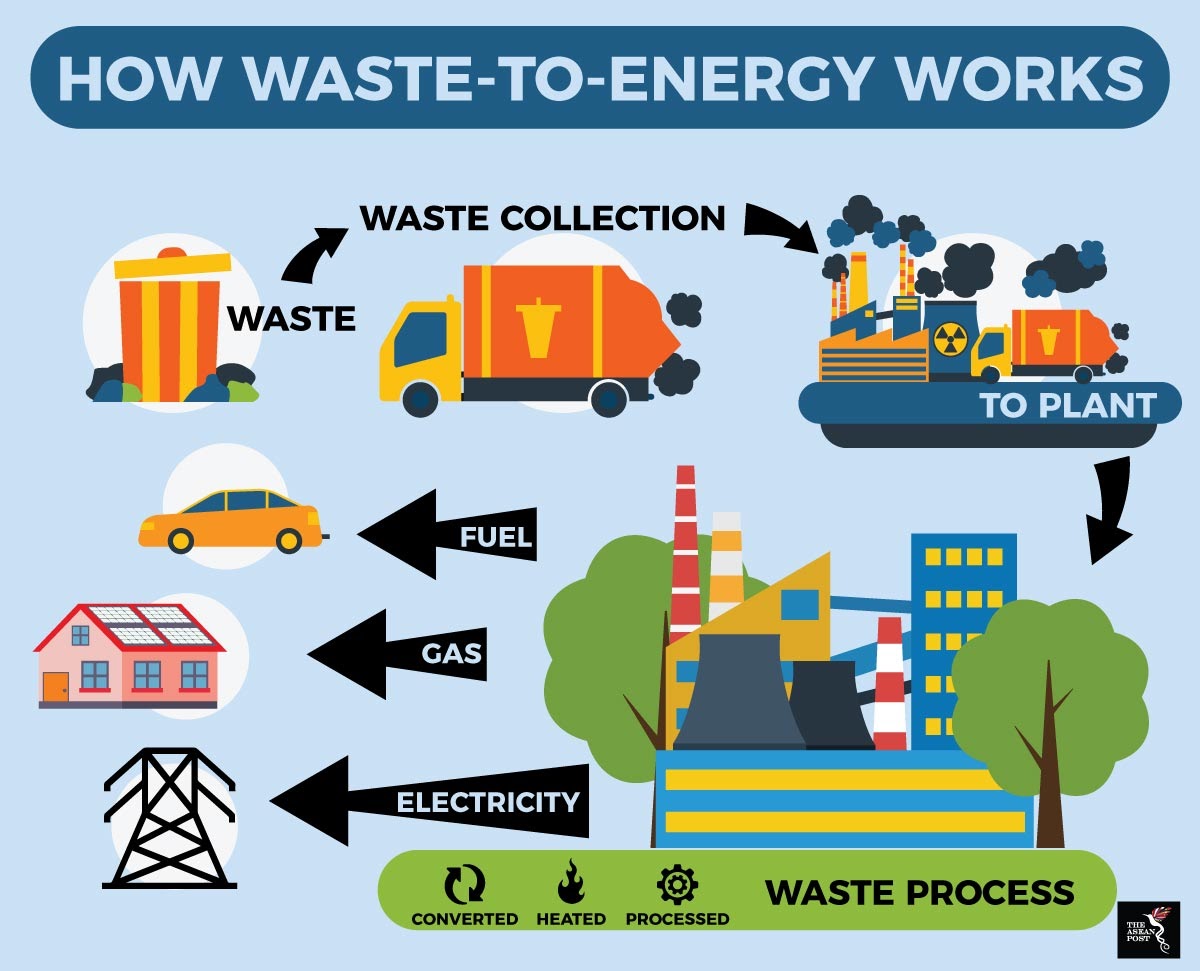
India is a developing nation housing second largest population in the world. Industrialization is the key to sustain the growth story of India. Industrialisation has led to urbanization and has therefore induced life style changes, giving rise to generation of increasing quantities of wastes leading to increased threats to the environment. In India, 62 million tonnes of waste is generated annually. The per capita waste generation in Indian cities ranges from 200 grams to 600 grams per day. Out of 62 million tonnes of waste, 43 million TPA is collected, 11.9 million is treated and 31 million is dumped in landfill sites, which means that only about 75-80% of the municipal waste gets collected and only 22-28 % of this waste is processed and treated. Waste generation in India is expected to increase rapidly in the future. As more people migrate to urban areas and as incomes increase, consumption levels are likely to rise, as are rates of waste generation.  It is estimated that the amount of waste generated in India will increase from 62 million tonnes to about165 million tonnes in 2030.This will have significant impact on the amount of land that is and will be needed for disposal, economic costs of collecting and transporting waste, and the environmental consequences of increased MSW generation levels.
In developed countries, environmental concern is the prime motivator for the countries to invest in waste-to-energy projects, which help in treating and safe disposition of wastes. Energy or power is considered as a by-product, improves the viability of such projects.
In an aim to boost WTE sector in India, Ministry of Environment and Forests has revised Solid Waste Management Rules which has introduced responsibility on generators to segregate waste into three categories – Wet, Dry and Hazardous Waste. The new Rules also assign responsibility on local bodies having 1 million or more population to set up waste processing facilities within two years. India, with its ambitious target of adding 175 GW of renewable energy to the grid by 2022 plans to add 10 GW of electricity generation capacity from bio-power. Further, the Tariff Policy 2016 mandates power distributors to buy all the electricity generated from waste-to-energy plants in a state and the remunerative tariff set for it by the Central Electricity Regulatory Commission (CERC) has helped raise investor interest in this segment. The municipal corporations are expected to receive Rs.15,000 crore over the next three years under the Swachh Bharat Mission for cleanliness, waste-management and waste-to-energy projects. Also, the government is also setting up a $1.25 billion fund, backed by state-owned Power Finance Corp. Ltd and Rural Electrification Corp. Ltd along with some private institutions. These allocations, together with private partnerships, could result in an investment of about Rs.65,000 crore in these projects over the next three years.
Table of Contents
  1. Executive Summary
  2. Approach & Methodology
  3. Types of WTE projects
    1. Urban Wastes
      1. Municipal Solid Waste
      2. Sewage
      3. Fecal Sludge
    2. Industrial Waste
  4. Key Regulations & Policies governing Waste to Energy (WTE) Sector
    1. Electricity Act, 2003
    2. National Electricity Policy
    3. Tariff Policy
    4. Central Sector Regulations
    5. State Regulations
  5. Policy/Financial Incentives for establishment of WTE projects in India
    1. Central Government
    2. State Government
  6. State-wise potential of WTE in India
  7. State-wise capacity addition over the years
  8. Permits & Clearances – assessing ease of setting WTEproject in India
    1. Number of clearances required – central & state
    2. Time taken to acquire permits & clearances
    3. Challenges in acquiring land
  1. Best States to invest in WTE projects in India
    1. Policy Attractiveness
    2. Ease of setting up solar project
    3. Paying ability
    4. Industry Cluster
    5. T&D infrastructure
  2. Appropriate Technology Options
    1. Incineration Technology
    2. Biomethanation process
    3. Pyrolysis
    4. Gasification
  3. State-wise Tariffs applicable for WTE projects in India
  4. Market participants in WTE Sector in India
    1. Private Sector
    2. Public Sector
  5. Status of MSW based Power Generation Projects
    1. Jindal power project, Okhla
    2. Solapur Bioenergy Systems Pvt. Ltd.
    3. Rochem Green Energy Pvt. Ltd (RGEPL)
    4. Essel Infra Pvt. Ltd
  6. Challenges faced byWTE Projects in India
  7. Business Opportunity along WTE value chain
Key Questions Answered
  1. What are the policy measures in place to promote WTE?
  2. Which are the municipal bodies that are investing in MSW to Energy projects?
  3. What are the different operational and planned WTE projects in India?
  4. Which are the top technology companies in WTE sector?
  5. How solid waste management is anticipated to happen in a smart city construct?
  6. What is the commercial structure under which WTE projects are operated?
  7. Which is the leading EPC Company in WTE space?
Value Propositions

We create value for our customers by amalgamating deep functional and energy industry expertise. Our solutions range from in depth research reports to advisory services enabling our customers with energy market insights to take informed decisions, grow and improve on their competitiveness.

Leveraging our breadth of geographical reach we provide solutions in entire energy value chain be it coal, power, oil and gas or renewable. We are a reliable and efficient source comprising of best in class talent pool which provides answer to all the challenges of the energy industry.

Upcoming Reports

Evaluating CBG Market in India 2030

September 19, 2023 admin No Comments
Overview of Reports
Table of Contents
Request Flyer
Overview of Reports

Evaluating Compressed Bio Gas Market Potential in India by 2030: Fuel of Future for Enabling Tryst of India for Energy Transition & Energy Security

Biogas is fuel produced by the anaerobic decomposition of organic waste such as agricultural waste, plant waste and organic municipal waste. Compressed biogas (CBG) is then produced by further processing of biogas in which other gases like carbon dioxide are reduced and methane is maintained at more than 90 percent quantity. CBG is also referred to as bio-CNG and could be directly used in vehicles that usually use CNG or compressed natural gas which is a fossil fuel. CBG is also used as an alternative to natural gas for cooking and in other industries like cement and steel.

Earlier this year, Prime Minister Narendra Modi inaugurated one of India’s biggest CBG (bio-CNG) plants at Indore in Madhya Pradesh, named Gobar-Dhan, which has the capacity to process 550 tonnes of waste and produce 17,000 kilograms of bio-CNG each day. The Indore Municipal Corporation (IMC) has also tied up with Gobar-Dhan and has assured the purchase of 50 percent of the fuel to run its CNG buses. IMC has also promised to provide sufficient segregated waste to the plant to ensure adequate feedstock for its biogas production.

Apart from all the state-specific investments which provide a major boost to the sector, leading corporate houses Reliance Industries and Adani New Industries Limited (ANIL) have also planned to invest Rs. 500-600 crores each in the sector. While ANIL reportedly plans to use its existing city-based gas network to use CBG in cooking fuel, Reliance Industries is expected to use its fuel outlets in India, for automobiles. However, the companies are yet to make official announcements regarding their investments.To boost availability of affordable and clean transport fuels, a MoU was signed today between MoPNG and leading oil & gas marketing companies & technology providers to establish Compressed Bio-Gas CBG) plants across India under the Sustainable Alternative Towards Affordable Transportation (SATAT) initiative, in the presence of Union Minister of petroleum and Natural Gas & Steel Shri Dharmendra Pradhan.MoUs  were signed with energy companies viz. JBM Group, Adani Gas, Torrent Gas and Petronet LNG for setting up of Compressed Bio-Gas (CBG) plants,and with technology providers in CBG sectors IndianOil, Praj Industries, CEID Consultants & Bharat Biogas Energy for facilitating availability of technology for the projects.

InfraInsights believes that growing interest in CBG as one of the key sources of clean energy that is indigenously available and could play key role in bringing down the reliance on imports for energy & also be a key avenue for decarbonization across industries. The government’s push with the policies and schemes seems to have given the sector an impetus. InfraInsights through its research report “Evaluating Compressed Bio Gas Market Potential in India by 2030” would enable companies both on the demand and supply side of market to take informed decision when it comes to making investment & also choosing CBG as they undergo their energy transition journey. Report will do a detailed assessment of feedstock potential to generate CBG in India, economically viable locations where CBG plants can be set, different business models like CBG as a service, distribution of CBG, adoption of CBG and different success stories in India and overseas, different ecosystem companies involved in CBG and the price dynamics and other factors influencing potential of CBG in India.

Table of Contents
  1. Executive Summary
  2. Natural Gas Landscape in India
  3. Significance of CBG in India’s Tryst for Energy Security
  4. Significance of CBG in decarbonization
  5. Understanding CBG Value Chain
  6. Policy Support for CBG in India
  7. CBG Potential in India
    1. Feedstock potential
      1. Livestock
      2. Sewag
      3. Food Waste
      4. Crop Residues
      5. Energy Crops
      6. Sugarcane press mud
      7. MSW
    2. Estimated production potential
  1. CBG Production Technology
  2. CBG Business Models in India
  3. CBG Supply Chain
  4. Potential Locations for Setting up CBG Plant in India
  5. CBG Market in India in 2022 and 2030
  6. CBG Pricing in India
  7. CBG end use application in commercial & industry segment
    1. Electricity Generation
    2. CHP
    3. Heating & Burning
    4. Biofuel
  8. Key challenges
  9. Case study on CBG plants in India
  10. Case study on CBG adoption in global markets
  11. CBG projects in India – Planned, Announced & Under Construction
  12. ULBs plan on CBG as tool for waste management
  13. Demand Barometer – Customer Survey on CBG Adoption
  14. Key Companies in CBG Space in India
    1. Equipment OEMs
    2. CBG Suppliers
    3. CBG Financiers
    4. OMCs
Request Flyer

Please contact us at info@infrainsights.com for the flyer

Upcoming Reports

Pumped Hydro Storage Opportunity in India

September 19, 2023 admin No Comments
Overview of Reports
Table of Contents
Key Qs Answered
Request Flyer
Overview of Reports

Pumped Hydro Storage Opportunity in India – Renaissance of Age-Old Self-Sustaining Water Battery Technology to Overshadow Battery Energy Storage?

Pumped hydro storage projects (PHPs) is a commonly used technology in which water is pumped from a lower elevation reservoir to a higher elevation using low-cost surplus off-peak electric power to run the pumps. During peak hour electrical demand, the stored water is released through turbines to produce electric power to balance shortages in the grid.

As per an estimation, India needs least 18 GW of pumped storage hydropower capacity to support the planned integration of wind and solar into India’s grid by 2032, and potentially more if other energy storage systems like BESS are not financially viable. The Indian Government has also recently revised its figure of pumped storage hydropower potential from 96 GW to 106 GW.

The Union Ministry of Power has come out with draft guidelines on pumped hydro storage projects.  The draft guidelines say India has on-river pumped storage potential of 103 GW. Besides, many off-river pumped storage potential is also available which is being estimated. As of now, 8 projects are presently in operation, 4 projects are under construction, and 24 projects have been allotted by states which are under different stages of development.

Pumped Storage Projects account for over 95% of installed global energy storage capacity, well ahead of lithium-ion and other battery types. It is estimated that pumped hydro projects worldwide store up to 9,000 gigawatt hours (GWh) of electricity. The energy supply from variable energy sources like solar and wind can’t be regulated fully since they are dependent on the time of the day, different seasons, and the vagaries of weather. India is planning to have over 500 GW of renewable energy by 2030, mainly solar.PSPs provide the necessary scale of storage and have a long service life of more than 40-50 years. This also results in a low cost of delivered energy over the life of the projects. They are non-polluting and are more environmentally friendly. InfraInsights research on Pumped Hydro Storage is will enable industry to get a perspective on potential, regulatory framework, planned & upcoming projects in different states, developers, success determinants and risks.

Table of Contents
  1. Executive Summary
  2. Approach & Methodology
  3. Pumped Hydro Storage (PHS) in India
    1. Overview
    2. Installed Capacity
  4. Statewise Estimated Potential& Operational PHS Plants in India
    1. Andhra Pradesh
    2. Jharkhand
    3. Karnataka
    4. Madhya Pradesh
    5. Maharashtra
    6. Odhisha
    7. Telangana
    8. West Bengal
    9. Gujarat
    10. Uttarakhand
    11. Tamil Nadu
  5. Regulatory Framework on Pumped Hydro Storage
    1. State
    2. Central
  6. Policy Initiatives on Pumped Hydro Storage
  7. Under construction & Planned Pumped Hydro Storage Projects in India
    1. Project Profile
      1. Technical
      2. Financial
    2. Pumped Hydro Storage in RTC Green Energy Supply
    3. Investments Planned in PHS
    4. PHS – Commercial Contract for Supply of Power
      1. Tariff
      2. Term contract
    5. PHS – Risks & Key Success Determinants
      1. Rainfall
      2. Irrigation
      3. R&R
    6. Projected PHS capacity in India by 2030
    7. Profiles of existing PHS plant in India
    8. Profiles of PHS developers in India
      1. Greenko
      2. JSW
      3. Adani
      4. Andritz
      5. NTPC
    9. Estimation on Opportunity Size for PHS Equipment by 2030
      1. Motor
      2. Generator
      3. Pump Set
      4. Hydro Turbine
    10. InfraInsights Perspective
Key Qs Answered
  • What is the overall estimated potential of Pumped Hydro Storage in India?
  • What are the policies governing PHS in India?
  • Which state are pushing for PHS projects in India?
  • What has been the success case studies on PHS projects in India?
  • What will be the opportunity for OEMs?
  • What is the capex planned, committed by different power project developers on PHS?
  • What is the status of different PHS projects in India
  • What are the factors influencing power sales agreement for power generated from PHS?
Request Flyer

Please contact us at info@infrainsights.com for the flyer

Recent Report

  • Renewable Energy Markets Competitiveness in India: Best States for Investments in Renewable Energy Sector in India September 20, 2023
  • InfraInsights Research Report on LPG Market in India by 2030: Statewise and District Wise Monthly Sales of LPG by OMCs and PMCs September 20, 2023
  • WASTE TO ENERGY OPPORTUNITIES IN INDIA September 20, 2023

Categories

  • Published Reports64
  • Upcoming Reports5

InfraInsights is an independent business information and market analysis company that assists companies in the infrastructure industry through independent fact-based insight, ensuring their business success today and tomorrow.

Phone : +91-87798-38473
E-mail : info@infrainsights.com

Company

  • About Us
  • Clients
  • Careers
  • Contact Us

SERVICE OFFERING

  • Report
  • Research
  • Consulting
  • Analytics
  • Databases

Our Newsletter

Get in your inbox the latest News

Copyright © 2023 Infrainsights, All Rights Reserved.| Developed by WTS